
Figure 6.
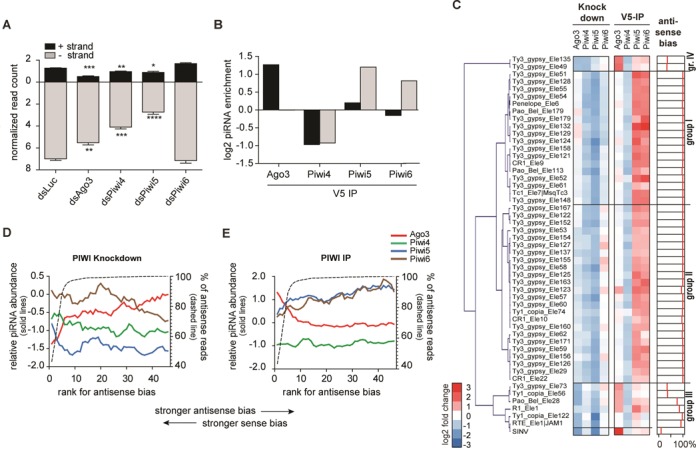
Association of TE-derived piRNAs with different PIWI proteins. (A) Normalized read counts of 25–30 nt reads from the different knockdown libraries mapping to the TEfam transposon database. The mean +/− SEM of three independent libraries are shown. Two-tailed student's t-test was used to determine statistical significance (*P < 0.05; **P < 0.01; ***P < 0.001; ****P < 0.0001). (B) Enrichment of 25–30 nt reads in the V5-IP of the indicated PIWI proteins compared to the GFP-IP. The number of reads from the (+) strand (black bars) or (−) strand (gray bars) in panels A and B was normalized to the corresponding library size. (C) Relative changes of the top 50 transposons upon PIWI protein knockdown and IP. Left panel: heat map showing the relative piRNA abundance in the indicated knockdown libraries compared to the control knockdown (dsLuc). These data were used to generate the hierarchical clustering. Middle panel: heat map showing the relative piRNA abundance in the indicated IP libraries over the control IP (GFP). Right panel: antisense bias, defined as the percentage of antisense 25–30 nt reads that uniquely map to the individual transposon sequences. (D,E) The 50 transposons from panel C were ranked according to their antisense bias. The mean relative piRNA abundance (log2-transformed) for five consecutive transposons is plotted with an offset of one rank number for the indicated knockdown libraries (D) or IP libraries (E). The corresponding antisense bias is indicated with the dashed line.