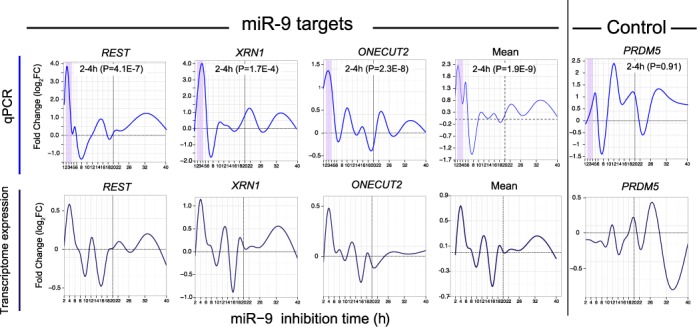
Figure 4.

Time series qPCR of selected positive and negative example genes. The time schedule for the qPCR was from 1 to 40 h with a higher hourly time resolution at the early time points. qPCR over three pooled biological replicate samples was performed using the identical miR-9 inhibition protocol to the transcriptome–wide study. The response of the three predicted miR-9 direct target genes REST, XRN1 and ONECUT2 and the mean of these (top panel) qualitatively matched the major features of the response seen in the transcriptome–wide analysis (bottom panel), with an initial large peak at 2–4 h and a mean upward peak at approximately 32 h. The mean FC from 2 to 4 h (purple highlight) of REST, XRN1 and ONECUT2 was significantly higher than the background mean FC variance over the rest of the time course from 5 to 40 h (t-test). The qPCR analysis reveals that the early direct response peak may initiate as early as 2–4 h. The negative control gene PRDM5 by contrast did not show a dominant peak at 2–4 h and the mean FC over 2–4 h was not significantly higher than over 5–40 h.
