Figure 5.

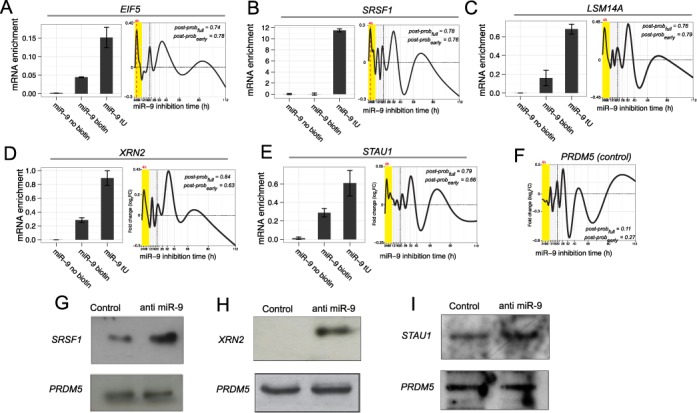
Experimental validation of selected predicted miR-9 targets: EIF5, SRSF1, LSM14A, XRN2 and STAU1. PRDM5 is a predicted non-miR-9 target as a control. (A–E) shows miR-9 pull-out validation. Biotin-tagged and thiouridine-labelled miR-9 was transfected into the L428 HL cells and qPCR used to measure their ability to pull-down the corresponding messages, qPCR was normalized to input (see ‘Materials and Methods’ section for details). ‘miR-9 tU’: miR-9 labelled with biotin and containing 4-thiouridine, leading to pull-down; ‘miR-9 biotin’: miR-9 labelled with biotin only, as control; ‘miR-9 no biotin’: miR-9 only, as control. Error bars show SEM (n = 3). The corresponding mean dynamic response curves are shown (yellow highlights the 2–10 h early time points). EIF5, SRSF1, LSM14A, XRN2 and STAU1 show significant miR-9 tU pull-down evidence of miR-9 targeting compared to controls with biotin only or without biotin and the time series curves show the expected peak at 4 h. By contrast, the negative control PRDM5 time series curve (F) does not show a characteristic peak at 4 h. (G–I) shows western blots for SRSF1, XRN2 and STAU1 validating translational induction compared with the scramble control; the non-target PRDM5 by contrast shows no substantial change relative to control.
