Figure 7.

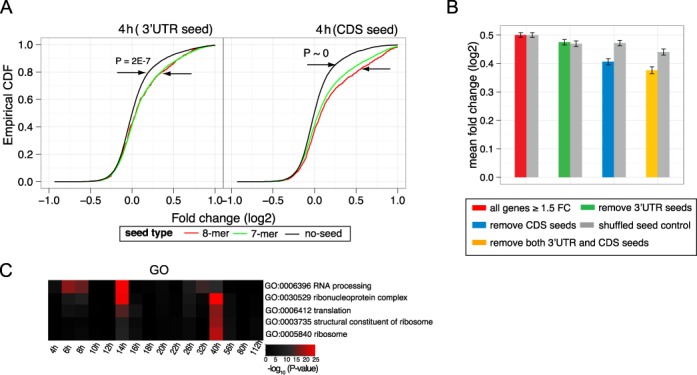
(A and B) CDS miR-9 targets show a substantial degradation response. (A) Cumulative distribution, at 4 h, of FC for genes with one or more 3′UTR or CDS miR-9 seeds, compared with genes with no miR-9 seeds, demonstrating an enrichment of miR-9 seeds in both CDS and 3′UTR. (B) Decrease in FC on removing genes from an initial set of all genes showing ≥1.5 FC at 4 h (red). The genes excluded were those containing miR-9 7-mer seeds in: 3′UTR (green), CDS (blue) and whole gene body (yellow), respectively. These were compared with controls (grey) which used a shuffled miR-9 seed sequence. Notably, removing CDS seed sites showed a substantial decrease in FC relative to randomized controls, while removal of 3′UTR seeds was not greater than random control. Note that the randomized control seed sets also show a small systematic decrease in FC which is likely due to systematic dependencies between FC and UTR/CDS length. (C) Heatmap of gene ontology (GO) functional enrichment based on expression FC across time. Red = statistical significance. There is a functional shift from mRNA processing at early time points to translational terms at later time points. GO terms were included where highly significant enrichment with P-value < 1E-7 occurred at any time point (see Figure S12 for full heatmap).
