
Figure 4.
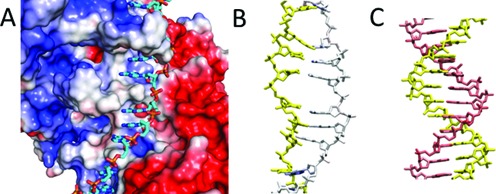
Potential maps of the presynaptic filament and B-DNA. (A) Map for the presynaptic filament at the surface of the protein and the initiating strand (both in surface representation), where blue corresponds to +3 kT/e, white is neutral, and red corresponds to −3 kT/e. The potential includes the effects of charges in the initiating strand. The complementary strand (in stick representation) is not present in the presynaptic filament, but it is shown to indicate the position it occupies when dsDNA is bound to site I. The complementary strand coloring represents the atomic content, not the potential. It is positioned in a neutral region separating regions with strong positive and negative potentials (12). (B) Same as panel (A), but only the potential at the position of the complementary strand is shown. The protein is not shown, and the initiating strand is shown in yellow in stick representation. The nearly white color in the complementary strand indicates that the potential is almost neutral on this scale. Similar results are obtained for the same conformation of the two DNA strands (stretched-unwound form) in the absence of the protein, as shown in Supplementary Figure S3. (C) Calculation for B-form dsDNA analogous to the calculation shown in Supplementary Figure S3, mapping the potential exerted by one (yellow) strand on the complementary strand. The pink color indicates a negative potential.