Figure 3.

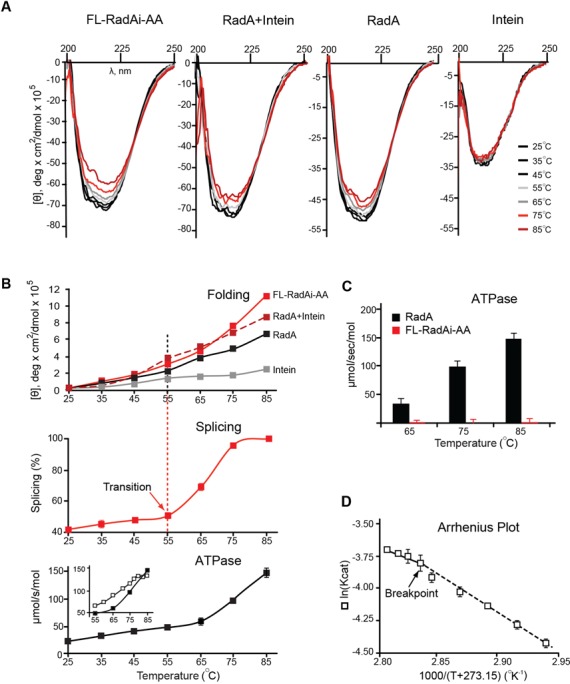
Temperature-dependent structure transition and ATPase activity of the Pho RadA protein and the precursor. (A) Far UV circular dichroism (CD) spectra. CD spectra of the splicing-inactive FL-RadAi-AA precursor, the RadA protein, RadA + Intein and Intein alone were recorded from 25–85°C with 10°C increments. (B) Temperature dependence of secondary structure transitions, splicing and ATPase activity. Top: Ellipticity at 217–223 nm measured for the four protein combinations in panel A. Middle: FL-RadAi splicing plot derived from data in Figure 2B. Splicing increases sharply at the structural transition, above 55°C. Bottom: ATPase activity of RadA. Inset corresponds to data used in panel D. CD data are from the experiment represented in panel A. Splicing and ATPase activity measurements in all panels were performed in triplicate at the temperatures indicated and error bars represent standard deviation. (C) ATPase activity of RadA and FL-RadAi at different temperatures. ATPase activity of inteinless RadA (black) increased with temperature while FL-RadAi (red) containing the inactive intein had no detectable ATPase activity. The experiment was performed in triplicate and error bars represent standard deviation. (D) Pho RadA exhibits biphasic ATPase activity. The Arrhenius plot demonstrates two distinct catalytic modes (55–76 and 76–83°C) with a slope change (Breakpoint) close to 76°C. The experiment was performed in triplicate and error bars represent standard deviation.
