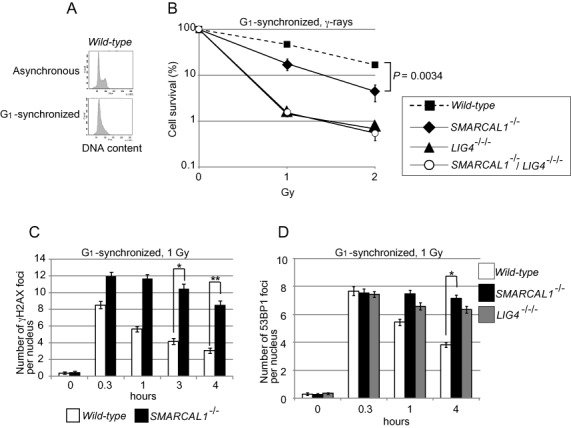
Figure 3.

Repair of γ-ray induced DSBs at the G1 phase in TK6 cells. (A) DNA content of G1-synchronized TK6 cells. (B) Cellular sensitivity of G1-synchronized cells to γ-rays, shown as in Figure 1. Error bars indicate the SD of the mean for three independent assays. P-value was calculated by Student's t-test. (C) Histogram representing the γH2AX subnuclear foci of G1 cells after irradiation with 1 Gy γ-rays. The x-axis represents time after γ-irradiation (time zero); the y-axis represents the average number of γH2AX foci in individual cells. The nuclei of 100 morphologically intact cells were analyzed at each time point in individual experiments. The experiment was performed at least three times, with the averages presented with SD and P-values. Asterisks indicate statistical significance; *P = 0.0055 and **P = 0.00020. (D) Histogram representing the 53BP1 subnuclear foci of G1 cells, as shown in (C). The experiment was performed at least three times, with averages presented with SD and P-value. Asterisks indicate statistical significance; *p = 6.3×10⁻⁵.
