
Figure 6.
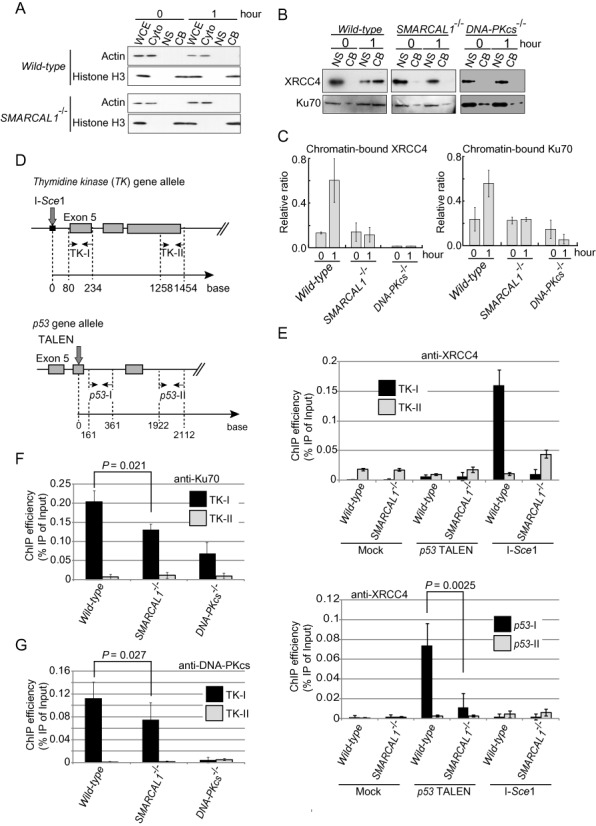
The loss of Smarcal1 results in compromised accumulation of Ku70, DNA-PKcs and XRCC4 at DSB sites. (A) Western blot data showing the validation of fractionation of the cytoplasmic (Cyto), nuclear soluble (NS) and chromatin-bound (CB) fractions isolated from the whole-cell extract (WCE). (B) Western blot data show the accumulation of XRCC4 (upper panel) and Ku70 (lower panel) in the chromatin-bound fraction after one-hour exposure of cells to ICRF193. (C) Histogram showing the quantification of XRCC4 and Ku70 in (B). The y-axis represents the amount of the chromatin-bound fraction relative to the total amount of the chromatin-bound fraction plus the nuclear soluble fraction. (D) Downward arrows represent the I-Sce1- (upper) and the TALEN- (lower) cutting sites in the TK and p53 genes, respectively. Pairs of horizontal opposing arrows indicate the sets of primers for quantitative real-time PCR. (E) Histograms represent the accumulation of XRCC4 near the I-Sce1-induced DSB in the TK locus (upper panel) and near the TALEN-induced DSB at the p53 locus (lower panel). (F) Histogram represents the accumulation of Ku70 near the I-Sce1-induced DSB in the TK locus. (G) Histogram represents the accumulation of DNA-PKcs near the I-Sce1-induced DSB in the TK locus.