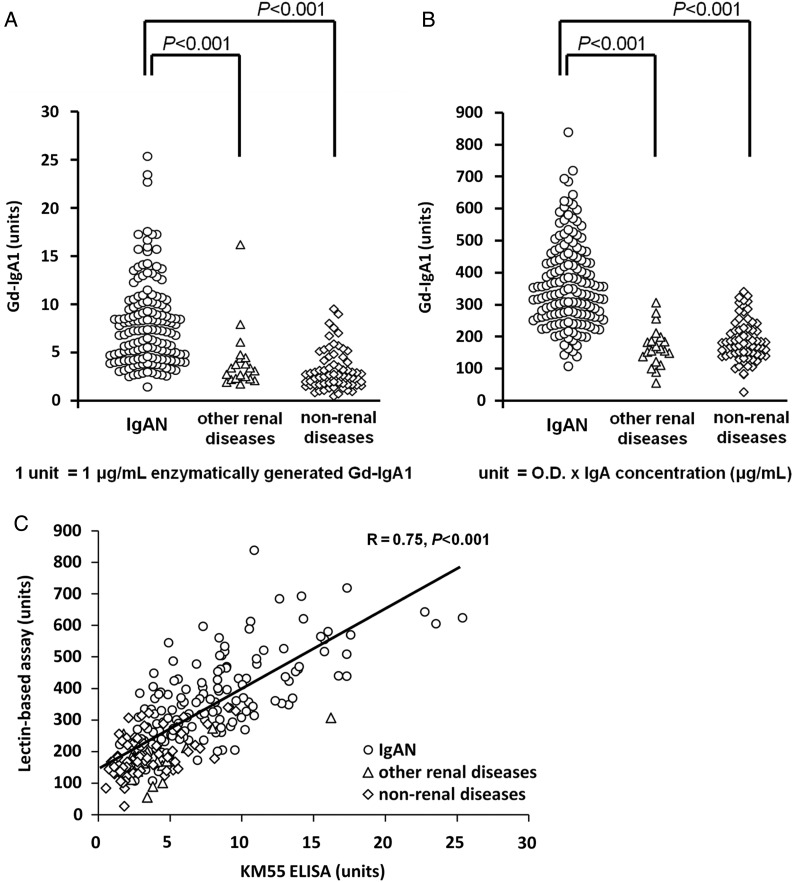
FIGURE 3:
Serum Gd-IgA1 levels measured by Gd-IgA1 ELISA and HAA lectin-based assay. (A) Serum Gd-IgA1 levels in patients with IgAN, other renal diseases and non-renal diseases were determined by Gd-IgA1 ELISA; (B) The same samples were measured for serum Gd-IgA1 levels by HAA lectin-based assay; (C) Relationship between Gd-IgA1 ELISA and HAA lectin-based assay was analyzed. Results from patients with IgAN (circles), other renal diseases (triangles) and non-renal diseases (rhombi) were plotted. The values obtained by these two independent methods exhibited positive correlation (R = 0.75). P-values of <0.05 were considered to be statistically significant.

