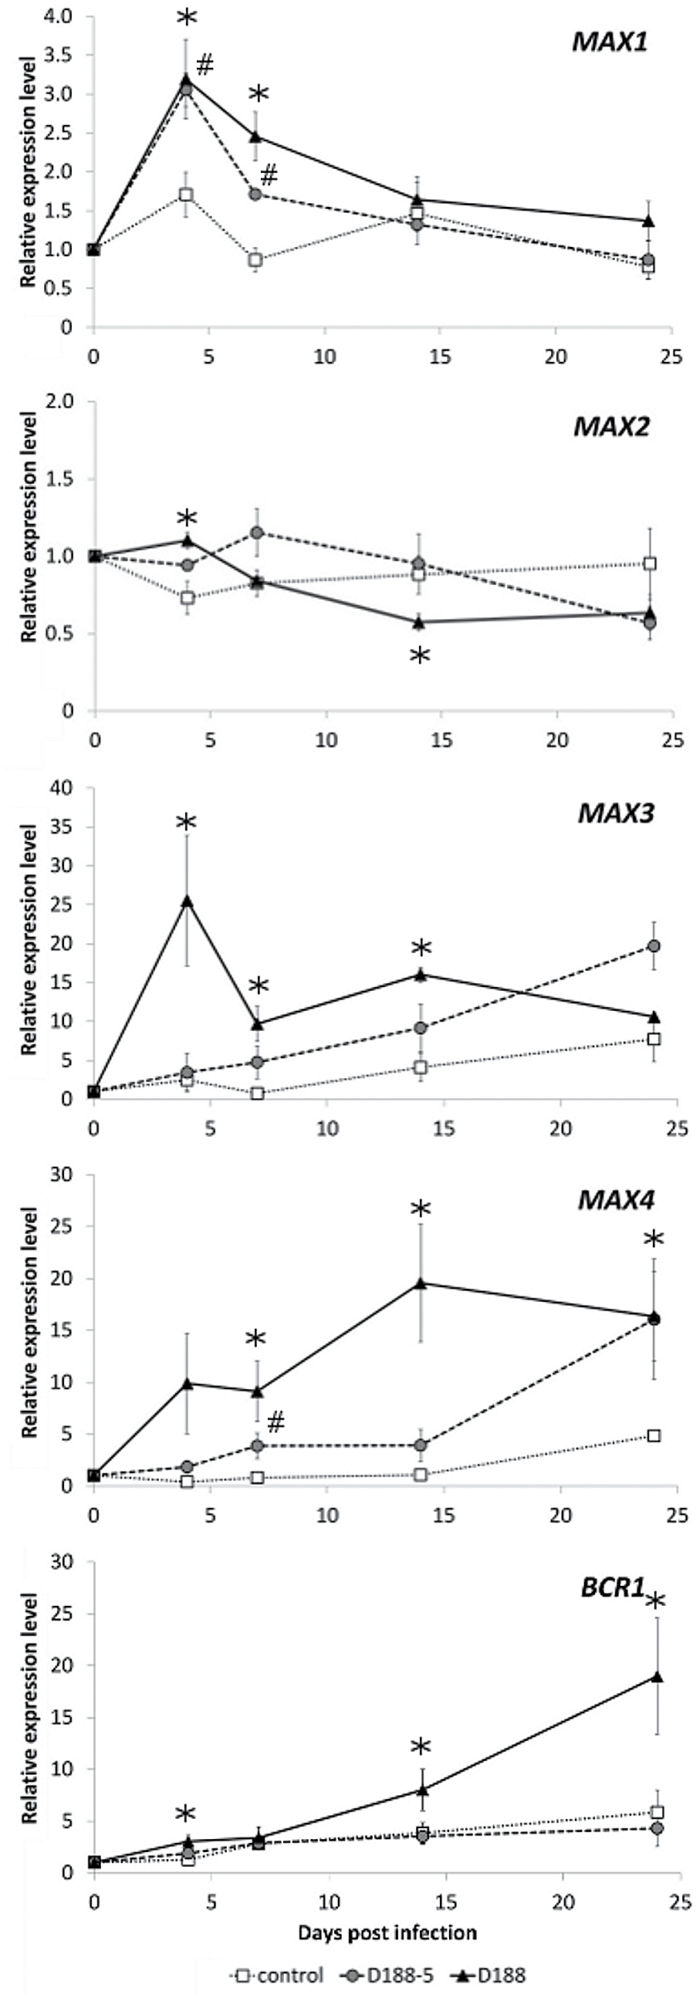
Fig. 3.
Transcript profiles obtained by qRT-PCR of strigolactone-related genes during R. fascians-induced symptom development in Arabidopsis Col-0. Error bars indicate standard errors (n = 3). Hashes and asterisks mark statistically significant differences (Student’s t-test; P < 0.05) between D188-5- and mock-infected (control) samples and between D188-infected and control samples, respectively.

