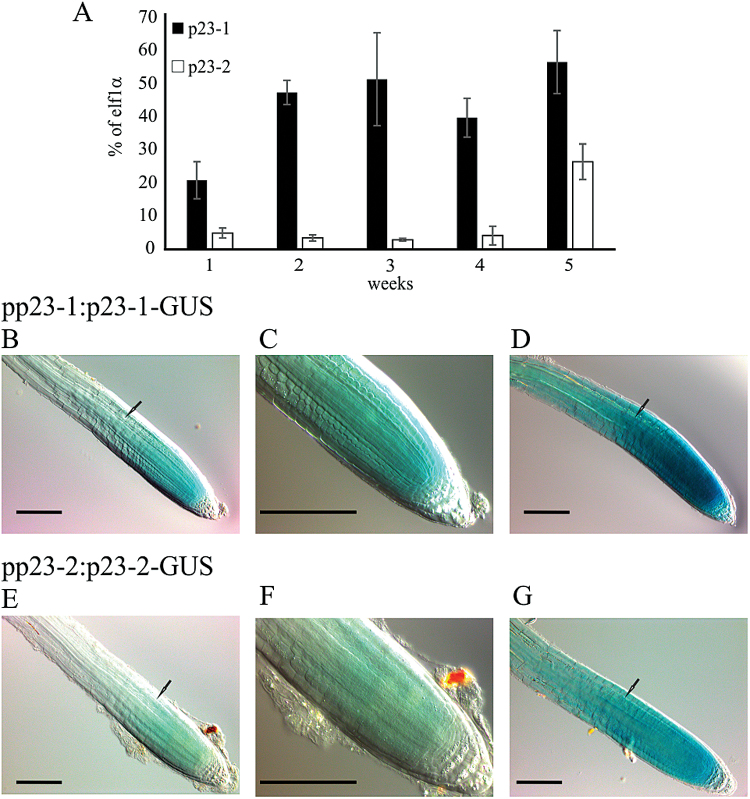
Fig. 2.
Transcript levels of p23-1 and p23-2 and protein localization in planta. (A) Quantitative real-time analyses of the transcript levels of p23-1 and p23-2 in Arabidopsis plants, grown in soil from 1–5 weeks. Data are reported as percentage of elf1α transcript levels. (B–G) Histochemical analyses of the translational reporter of p23-1 and p23-2. (B, E) pp23-1:p23-1-GUS and pp23-2:p23-2-GUS Arabidopsis staining (30min) concentrates in the root meristem and drops above the first full-elongated cell (arrow). (C, F) Magnification of the root meristem. (D, G) Four hours of GUS staining reveals that both p23 proteins appear also in the upper part of the root. Scale bar = 100 μm. (A colour version of this figure is available at JXB online.)

