Fig. 3.
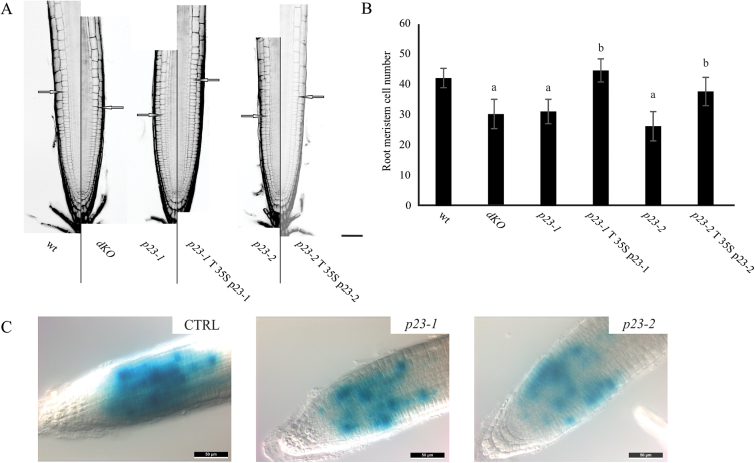
p23 mutant lines show a reduced number of cells in the root meristematic zone. (A) PI stained root of 7-d-old seedlings of the different lines. Excitation and emission wavelengths for confocal acquisition are 488nm and 600–650nm, respectively. The arrows show the upper limit of the meristematic zone. Scale bar = 50 μm. (B) Meristem cell number in the different genetic backgrounds. p23 mutant lines show a reduced number of cortical cells in the root meristematic zone, while complemented lines show no difference as compared with the wild-type (a P<0.01 compared with the wt, b P<0.01 compared with the background line; both Student’s t-test). (C) Histochemical analysis of the CyclinB1:GUS reporter in the wild-type (CTRL), p23-1, or p23-2 background. Scale bar = 50 μm. (A colour version of this figure is available at JXB online.)

