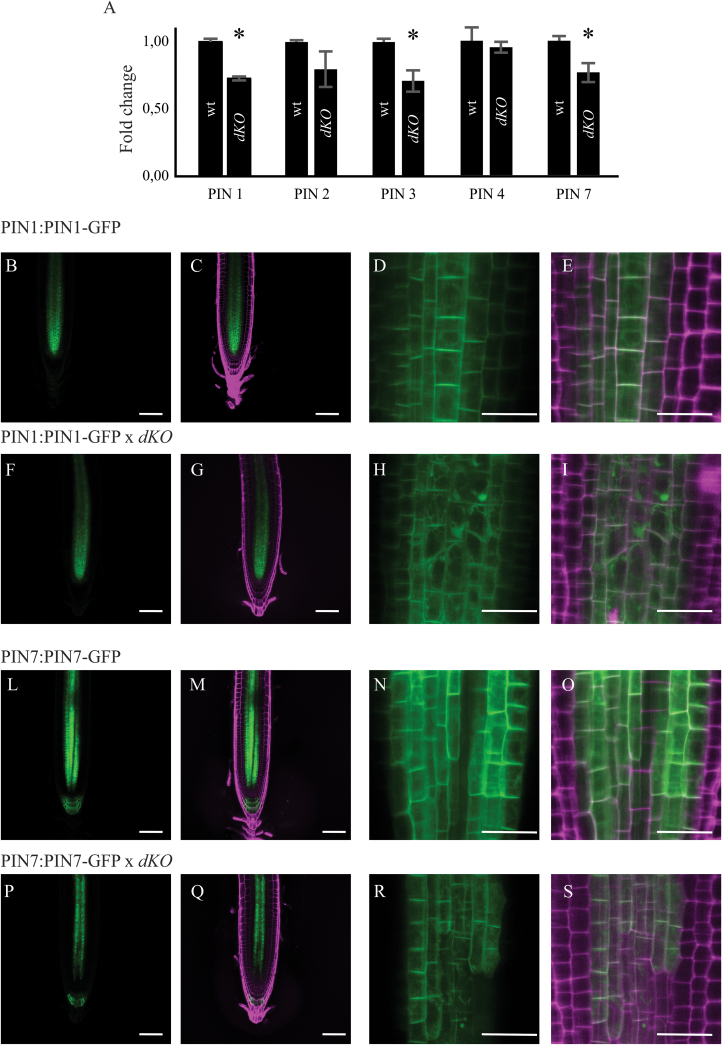
Fig. 5.
PIN expression levels, and PIN1 and PIN7 localization in the dKO. (A) qRT-PCR of PIN1, 2, 3, 4, and 7; data were normalized to ACT2 and shown as fold change on wild-type (*P<0.05, Student’s t-test). (B) Confocal Laser Scanning images of PIN1 (B–E), PIN1×dKO (F–I) or PIN7 (L–O) and PIN7×dKO (P–S) showing altered expression and localization of PIN1 and PIN7 in the mutant line. GFP Ex: 488nm, Em: 500–520nm; PI Ex: 488nm, Em: 600–650nm. Scale bars (B, C, F, G, L, M, P, Q) = 50 μm; (D, E, H, I, N, O, R, S) = 10 μm. (A colour version of this figure is available at JXB online.)

