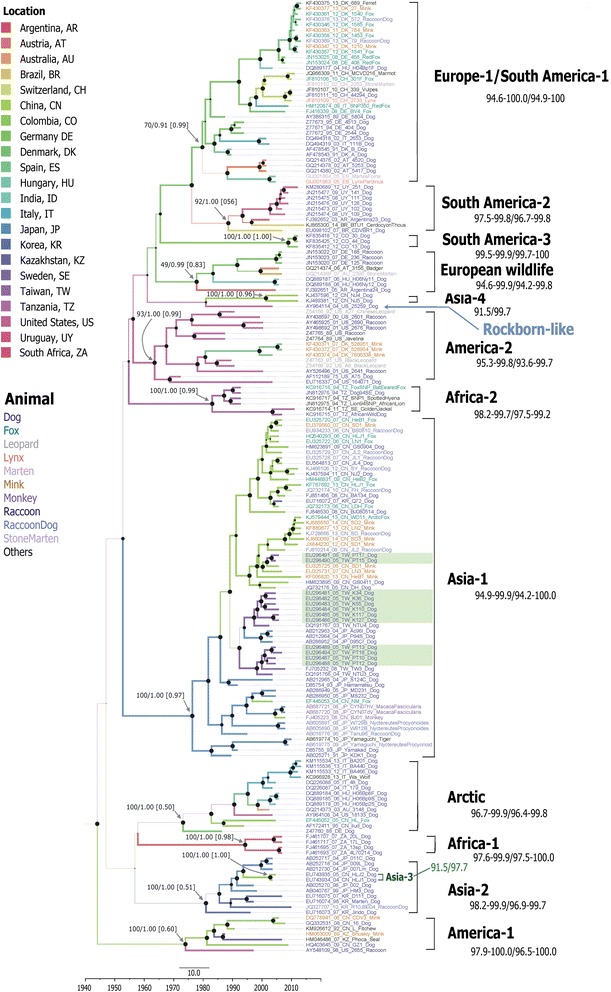
Fig. 3.

Maximum clad credibility tree based on 176 canine distemper virus H gene sequences. For each branch, the colour and thickness indicate the most probable location and probability of the state, respectively. For key nodes, the size of the node cycle represents the posterior probability (PP), and support values are labeled the nodes as either bootstrap (BS) or PP in BS-NJ/PP-BEAST. Numbers in parentheses are the PP values of each location. The scale bar on the bottom shows the time in years. The strain names are colored according to their host animal species. Genotypes and nucleotide/amino acid sequence similarities (%) appear on the right. Strains isolated in this study are shaded green
