
Figure 5.
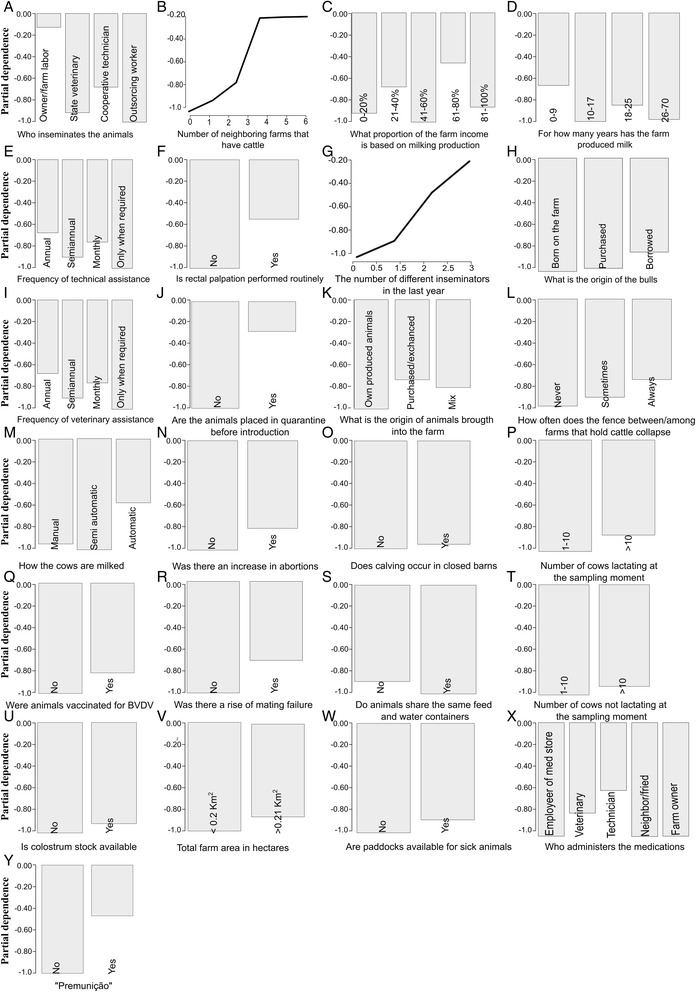
Partial dependence plots for the top 25 variables. Partial dependence plots for the top 25 variables with the variable importance scores as calculated by random forests. Plots show the partial dependence of a Relative Occurrence Index value for BVDV on each predictor variable; the y-axis is given in log scale [the logit function gives the log-odds, or the logarithm of the odds p/(1 − p)].