
Figure 3.
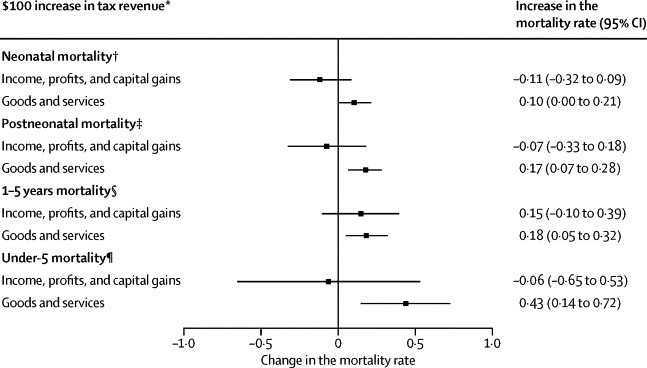
After correcting for health spending, the association of alternative tax regimes with child survival, 89 low-income and middle-income countries, 1995–2011
Source: World Bank Indicators and IHME. SEs are adjusted for repeated observations. All models correct for country-specific differences and time trends. The natural log of the dependent variable is used in these models. All models adjust for total public health spending and other tax revenue. *Adjusted for purchasing power parity and inflation, per capita. †Deaths per 1000 livebirths per year (before age of 1 month). ‡Deaths per 1000 livebirths per year (before the age of 1 year). §Deaths per 1000 livebirths per year (after the age of 1 year and under the age of 5 years); ¶Deaths per 1000 livebirths (under the age of 5 years). For full models see appendix.