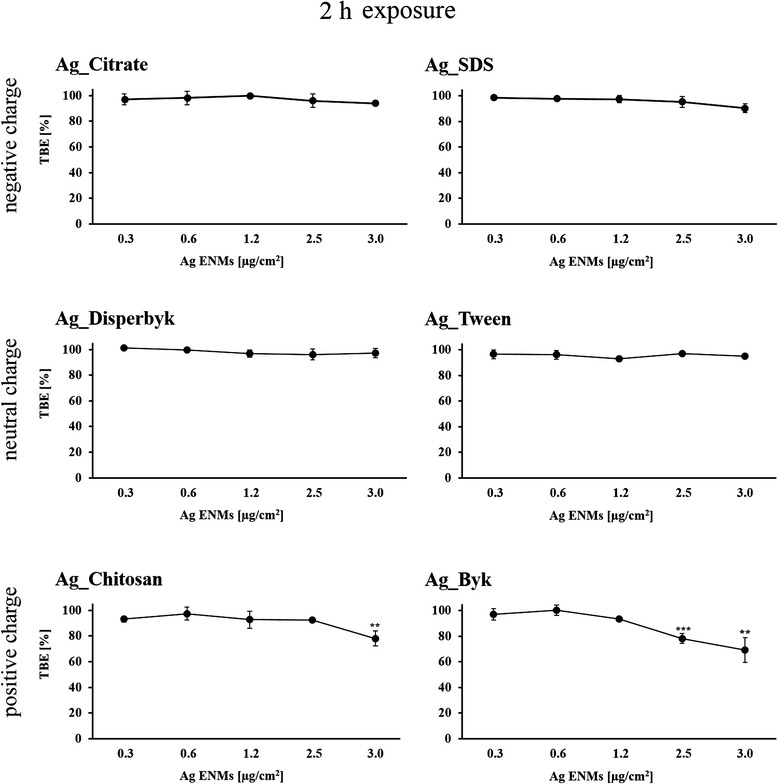
Fig. 3.

Cytotoxic and cytostatic effects of Ag ENMs with different charge (negative: Ag_Citrate and Ag_SDS; neutral: Ag_Disperbyk and Ag_Tween; positive: Ag_Chitosan and Ag_Byk) on TK6 cells measured as trypan blue exclusion (TBE) Cells were treated with 5 concentrations (μg/cm2) of Ag ENMs for 2 h and cell number was counted immediately after the exposure. Graphs represent cytotoxicity relative to 100 % of control. The data are expressed as mean ± SD of three independent experiments. P values indicate statistically significant results; *p < 0.05; **p < 0.01; ***p < 0.001
