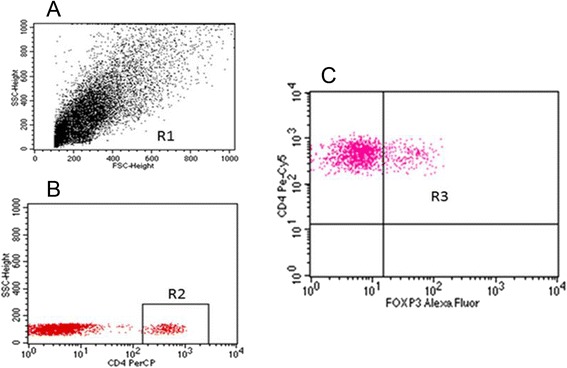
Fig. 3.

Sample analysis of the percentage of Treg cells in the tissue of tumor. a- Assessment of mononuclear cells (R1) based on FSC and SSC. b- Assessment of percentage of CD4+ cells (R2). c- Assessment of percentage of CD25 + FOXP3+ lymphocytes (R3) among CD4+ cells
