Fig. 1.
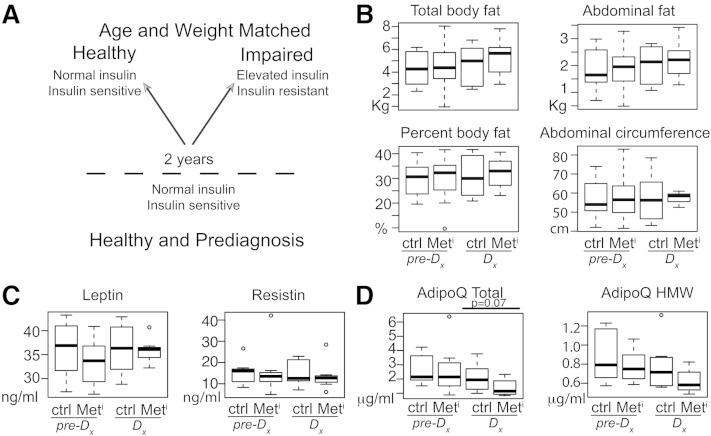
Spontaneous insulin resistance development is independent of a change in adiposity. Schematic of study design, eight animals per group per time point (A); total body fat, percent body fat, abdominal fat, and abdominal circumference (B); plasma leptin and resistin levels (C); and plasma total adiponectin and HMW adiponectin (D) in metabolic impaired (Meti) and age- and weight-matched controls (Ctrl) at time of diagnosis (Dx) and 2 years prior to diagnosis (pre-Dx); n = 8 per group per time point. Data are shown as medians and interquartile range (IQR); outliers are shown as open circles. Statistical significance based on univariate analysis (two-sample Wilcoxon).

