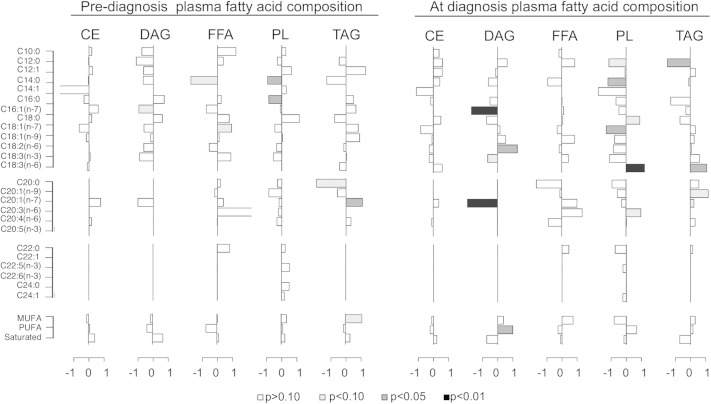
Fig. 3.
Plasma fatty acid composition profiles prior to and at onset of metabolic syndrome. Differences in fatty acid composition (percent of total species detected within class) of individual species between metabolic impaired and control groups prior to (left) and at time of diagnosis (right). Results are shown as the difference in medians divided by the median absolute deviation for each fatty acid species in plasma CE, DAG, FFA, PL, and TAG lipid classes. Species with bars that extend to the right are enriched in impaired animals compared with healthy animals; n = 8 per group per time point. Statistical significance based on univariate analysis (two-sample Wilcoxon) is shaded as indicated.

