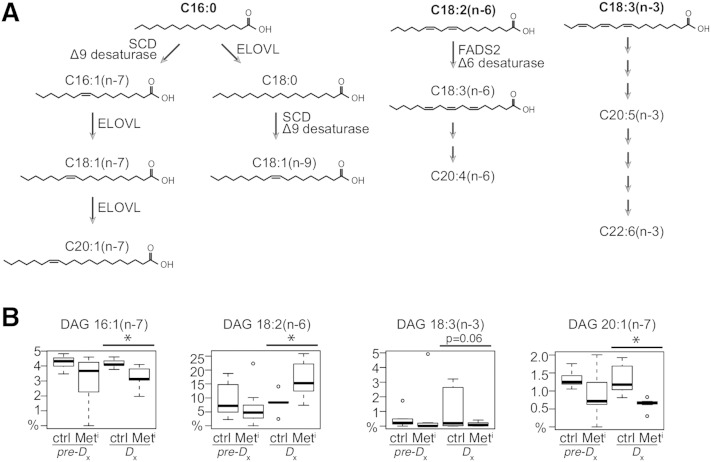
Fig. 4.
Changes in plasma DAG fatty acids with progression to metabolic syndrome. A: Schematic representation of fatty acid chain elongation and saturation from palmitic acid (C16:0) or dietary linoleic acid [C18:2(n-6)] and linolenic acid [C18:3(n-3)]. B: relative abundance of fatty acids that together constitute the DAG biomarker model. Data are shown as medians and IQR, and outliers are shown as open circles; n = 8 per group per time point. Statistical significance based on univariate analysis (two-sample Wilcoxon): * P < 0.05 for control versus impaired; Δ* P < 0.05 for difference between the changes for impaired and control animals from 2 years prior to time of diagnosis (MetiDx-Metipre-Dx) versus (CtrlDx-Ctrlpre-Dx).

