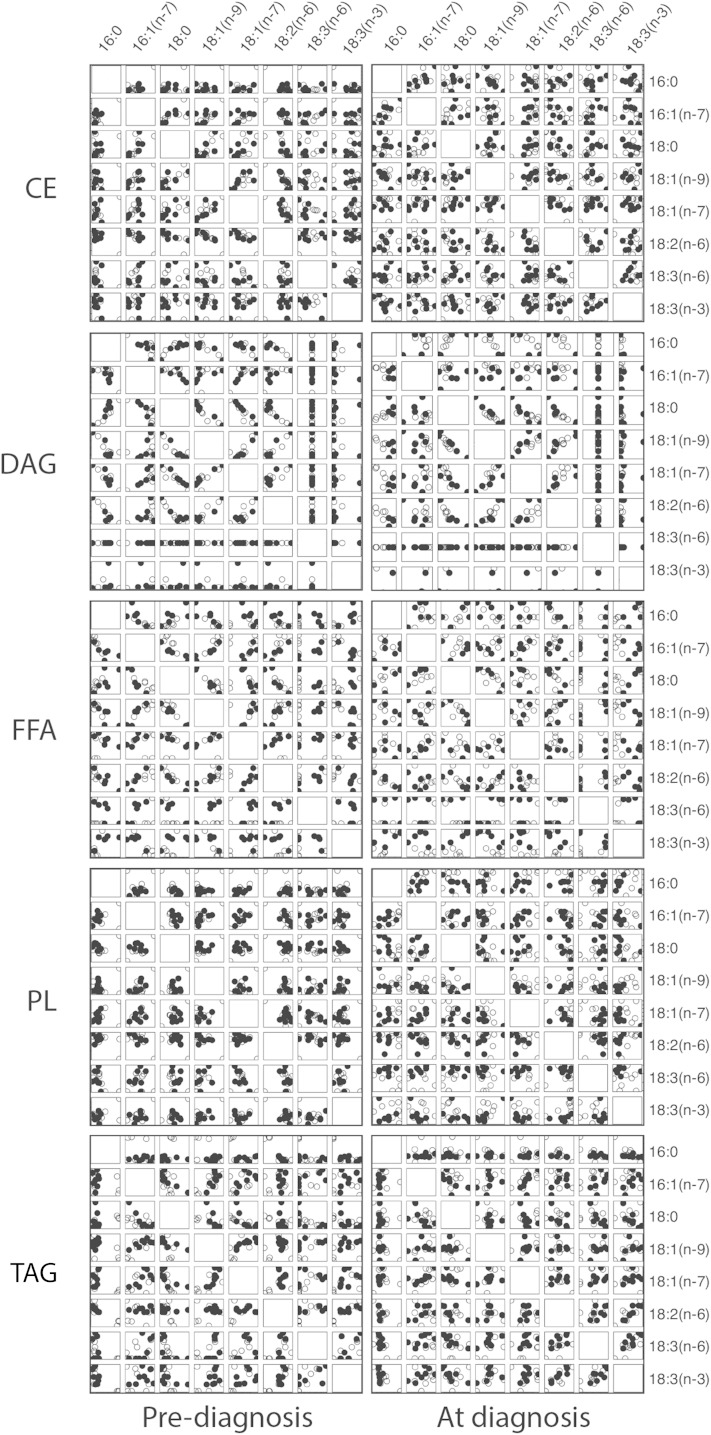
Fig. 5.
Lipid class-specific associations for fatty acid composition 2 years prior to and at time of diagnosis. Data are from healthy and impaired animals at time of diagnosis (right panels) and the same animals 2 years prior to diagnosis (left panels) when all animals were clinically identified as healthy. Fatty acid composition (percent of total species detected within class) data are plotted against each other for species from C16 and C18 chain length within lipid class. Lipid classes included plasma CE, DAG, FFA, PL, and TAG. Data are shown for control (open circles) and (pre-)impaired animals (filled circles); n = 8 per group per time point. Scales are not equivalent.

