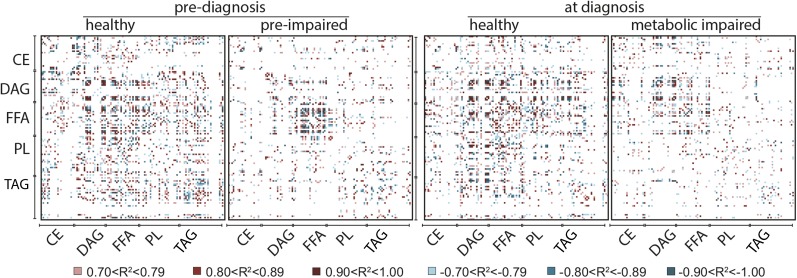
Fig. 6.
Correlations among plasma fatty acids reveal the lipid signature of metabolic syndrome. Large correlations of fatty acid composition (percent of total species detected within class) for fatty acids from plasma CE, DAG, FFA, PL, and TAG lipid classes calculated separately for healthy and impaired animals at time of diagnosis and 2 years prior when all animals were clinically identified as healthy. Positive and negative correlations are color coded as indicated; n = 8 per group per time point. The order of fatty acid species presented within each class from top to bottom and from left to right is as follows: C10:0, C12:0, C12:1, C14:0, C14:1, C16:0, C16:1, C18:0, C18:1(n-9), C18:1(n-7), C18:2(n-6), C18:3(n-6), C18:3(n-3), C20:0, C20:1(n-9), C20:1(n-7), C20:3(n-6), C20:4(n-6), C22:0, C22:5(n-3), C24:0, C24:1, saturated, MUFA, PUFA, where C24 species are detected in PL and TAG only. White areas indicate a correlation with absolute value ≤0.7 or species that fell below the threshold of detection.

