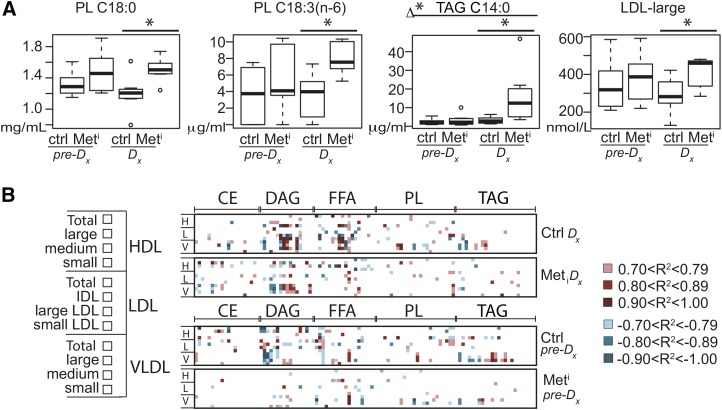
Fig. 7.
Lipid metabolic index connects fatty acid composition, lipoproteins, and adipokines to insulin resistance. A: Plasma levels of PL C18:0, PL C18:3(n-6), TAG C14:0, and LDL large particles shown as medians and IQR in metabolic impaired (Meti) and age- and weight-matched controls (Ctrl) at time of diagnosis (Dx) and 2 years prior to diagnosis (pre-Dx). Statistical significance based on univariate analysis (two-sample Wilcoxon) * P < 0.05 control versus impaired; Δ* P < 0.05 for difference between the changes for impaired and control animals from 2 years prior to time of diagnosis (MetiDx-Metipre-Dx) versus (CtrlDx-Ctrlpre-Dx). Variables shown are constituents of lipid index biomarker model. B: Large correlations of lipoprotein size distribution (listed left) with fatty acid percent composition calculated separately for healthy and impaired animals at both time points. Positive and negative correlation values are color coded as indicated; n = 8 per group per time point. Lipid classes include CE, DAG, FFA, PL, and TAG. The order of fatty acid species (from left to right within each class) follows: C10:0, C12:0, C12:1, C14:0, C14:1, C16:0, C16:1, C18:0, C18:1(n-9), C18:1(n-7), C18:2(n-6), C18:3(n-6), C18:3(n-3), C20:0, C20:1(n-9), C20:1(n-7), C20:3(n-6), C20:4(n-6), C22:0, C22:5(n-3), C24:0, C24:1, saturated, MUFA, PUFA, where C24 species are detected in PL and TAG only. White areas indicate a correlation with absolute value ≤0.7 or species that fell below the threshold of detection.

