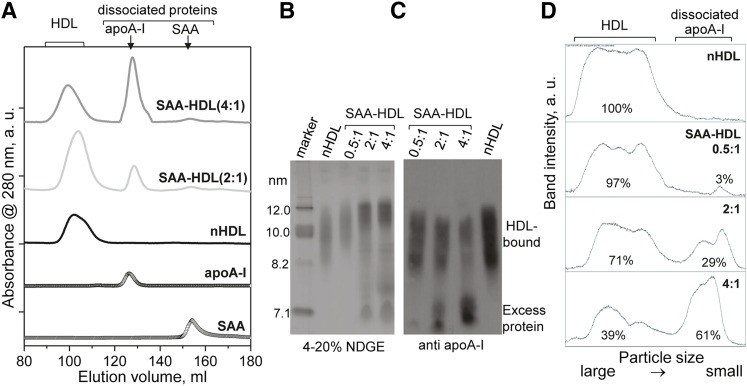
Fig. 1.
Characterization of SAA-HDL by SEC and immunoblotting. A: SEC profiles of SAA-HDL using Superdex-200 preparative grade XK 16/100 column. Elution by PBS (10 mM Na phosphate, 150 mM NaCl, pH 7.5) was carried out at a flow rate of 1 ml/min. The data were recorded from nHDL and from SAA-HDL that have been incubated at 2:1 or 4:1 SAA:apoA-I molar ratio. The peaks corresponding to HDL-bound and dissociated proteins are indicated. Free apoA-I and SAA are shown for comparison. The data were shifted along the y-axis to avoid overlap. The relative peak intensities, which were obtained by integration using Unicorn software of AKTA, are proportional to weight % of total protein: 100% HDL-bound protein in nHDL; 83% HDL-bound protein and 17% dissociated apoA-I in SAA-HDL (2:1); 52% HDL-bound protein and 48% dissociated apoA-I in SAA-HDL (4:1). (B–D) Quantification of HDL-bound and dissociated apoA-I in SAA-HDL by immunoblotting. SAA-HDL (0.5:1 to 4:1 mol/mol of SAA:apoA-I as indicated) were analyzed by NDGE (B) followed by immunoblotting for apoA-I (C) and band quantification (D). NDGE shows progressive increase in HDL particle size with concomitant protein dissociation (C). Western blot shows progressive dissociation of apoA-I from HDL. The apoA-I content was quantified by ImageJ analysis of the Western blot (54). The area under the peak was calculated in the calibrated mode. The % fraction of protein in each band is indicated. The results suggest preferential displacement of apoA-I from small HDL.

