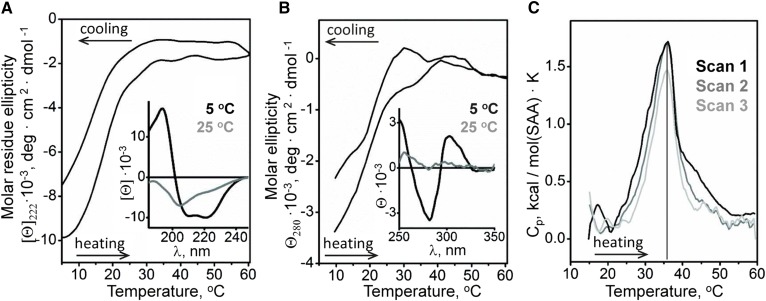
Fig. 2.
Structural transitions in lipid-free SAA in solution analyzed by CD spectroscopy and DSC. A: Far-UV CD spectra of SAA at 5°C and 25°C (insert) and the melting data at 222 nm to monitor α-helical structure. B: Near-UV CD spectra of SAA at 5°C and 25°C (insert) and the melting data at 280 nm to monitor aromatic packing. C: Heat capacity Cp(T) recorded in three consecutive DSC scans from the same sample containing 0.3 mg/ml SAA during heating from 10°C to 60°C at a rate of 90°C/h.

