Fig. 7.
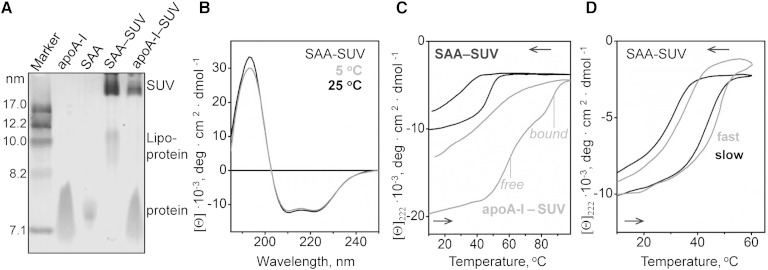
Characterization of SAA complexes formed upon incubation with SUVs of POPC. SAA was incubated with POPC SUVs at 1:100 protein:lipid molar ratio to form SAA-SUVs. A: NDGE shows that all SAA was bound to lipid, either to SUV (∼22 nm) or to SAA:POPC complexes in the HDL size range (9–11 nm). A similar sample containing apoA-I and POPC SUV, along with lipid-free apoA-I and SAA are shown for comparison. B: Far-UV CD spectra of SAA-SUV samples suggest similar helix content at 5°C and 25°C. C: CD heating and cooling data of POPC SUVs that have been incubated with SAA (black) or with apoA-I (gray) were recorded by CD at 222 nm. In intact samples, all SAA is lipid-bound, while apoA-I is distributed between lipid-bound and dissociated fractions whose thermal unfolding transitions are indicated. The data are in units of molar residue ellipticity, [Θ]. D: Scan rate effects on the melting data of SAA-SUVs. The CD data at 222 nm were recorded from two identical samples at a fast (70°C/h) and a slow (6°C/h) rate.

