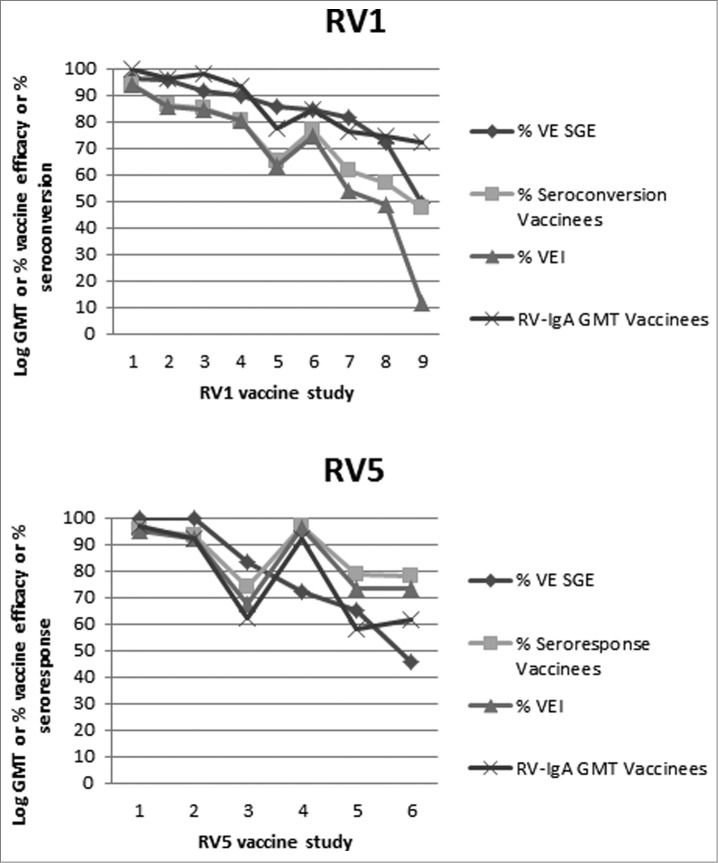
Figure 1.
Selected RV1 (top panel) and RV5 (bottom panel) trials are presented from left to right in order of decreasing VE against severe GE (SGE). For each trial the VE against SGE, seroconversion rate (RV1 trials) or seroresponse rate (RV5 trials), VEI and RV-IgA log GMT (the latter adjusted with a constant for scaling) are plotted. VEI was calculated based on seroconversion rates for RV1 and seroresponse rates for RV5 of vaccinees and placebo recipients. For RV1 the data was obtained from the GSK, Clinical study registers available at: http://www.gsk-clinicalstudyregister.com/ Accessed January 9 2012. The corresponding location and GSK Trial numbers are: 1: Asia 028–030, 2: Europe 036, 3: Japan 056, 4: Finland 004, 5: Latin America 006, 6: Latin America 023, 7: Latin America 024, 8: 037 in South Africa, 9: 037 in Malawi. For RV5 the trial references are: 1: Finland and US,98,99 2: Finland,99,100 3: Finland and US,72 4: Kenya,67,71 5: Vietnam,101 Ghana,67,71 6: Bangladesh.101

