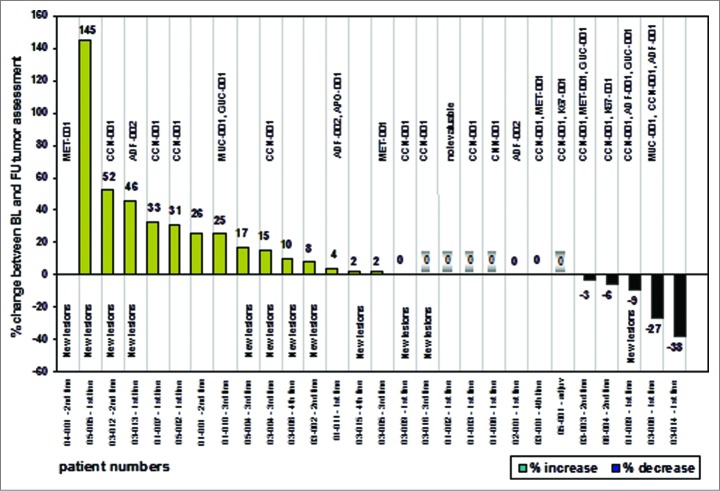
Figure 4.
Waterfall plot and vaccine-induced T-cell responses as indicated by the TUMAPs named above the bar representing the percentage of change in longest diameter of target lesions. The occurrence of new lesions is outlined and patients without measurable disease according to RECIST at baseline are marked with a shadow around the zero. Patient numbers and the treatment line of the vaccination therapy are illustrated.

