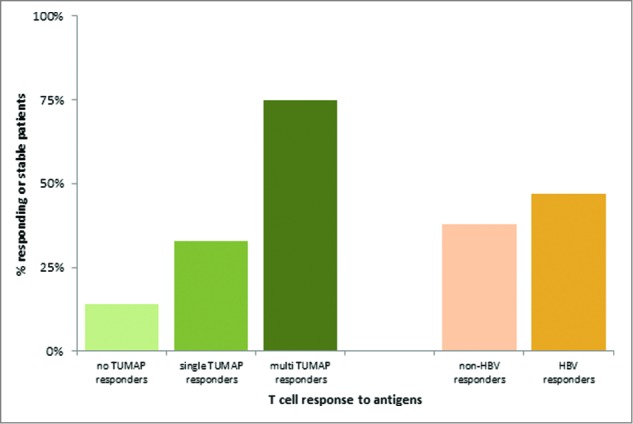
Figure 5.

Association between vaccine-induced T-cell responses and clinical benefit defined as responding or stable disease after 3 months of vaccination (at the follow up visit). The clinical benefit rates were 14%, 33% and 75% for patients with 0, 1 and ≥ 2 TUMAP responses, respectively. 38% of Non-HBV responders and 47% of HBV responders had their disease controlled at the follow up visit.
