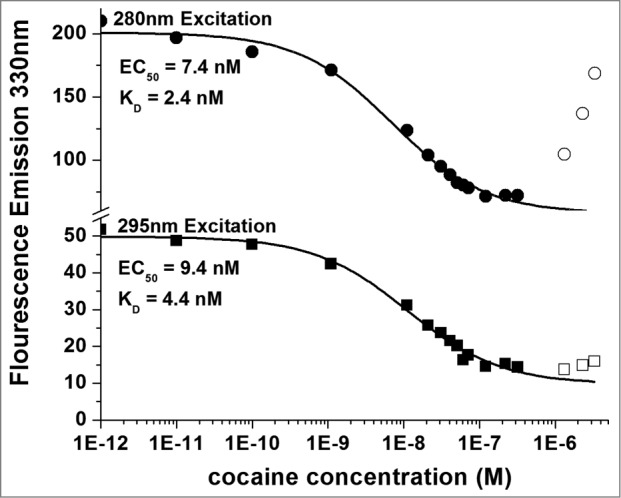
Figure 8.

Titration of 5 nM h2E2 antibody with cocaine, with excitation at both 280 nm and 295 nm. Only data represented by filled symbols were used for fitting to obtain the indicated sigmoidal curves to derive the EC50 values. Note the y-axis brake in scale to allow visualization of the quality of the fitted curves for both sets of data on a single plot. KD values were calculated from the EC50 values and the antibody or Fab concentration as described in Methods. For the experiment shown in the figure (using the intact h2E2 mAb and 295 nm excitation), KD = EC50 – (0.5 × 2 sites/mAb × 5.0 nM mAb) = 9.4 nM – 5.0 nM = 4.4 nM = KD for cocaine binding to the h2E2 monoclonal antibody.
