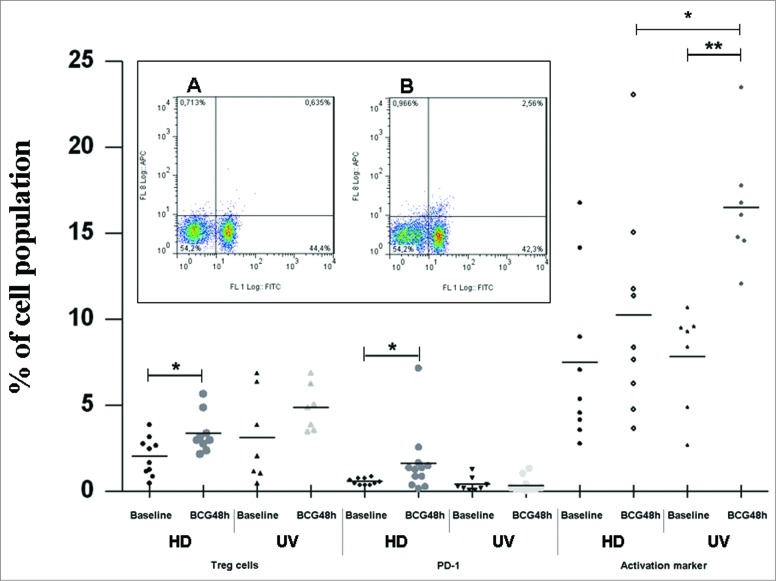
Figure 3.
Treg cells, PD-1 and CD25-activation markers induced by BCG Moreau at 48h in T cells from healthy donor (HD) and umbilical vein (UV) individuals. Bars depict the mean levels in each condition. *P ≤ 0.05; **P < 0.01. Insert shows a typical profile from one representative experiment for PD-1 and CD4 double staining for (A) baseline and (B) BCG Moreau-infected PBMC cultures evaluated by flow cytometry. In the dot plot, percentages of cells are indicated in each quadrant. The viable lymphocyte population was previously gated on the basis of their light scattering properties. FL-1 and FL-8 represent CD4 FITC and PD-1 APC staining, respectively.

