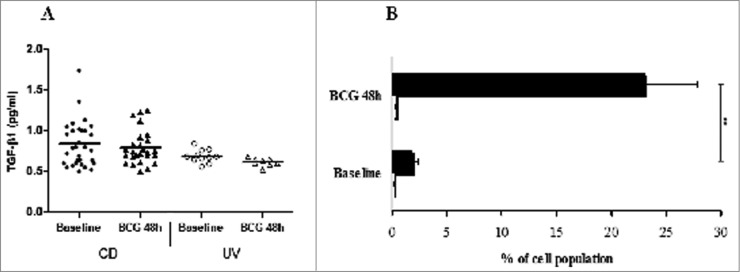
Figure 4.

(A) Transforming growth factor (TGF)-β1 levels in pg/mL measured by ELISA in the supernatants of PBMCs from healthy donor (HD) and CBMCs from umbilical vein (UV) individuals stimulated with BCG Moreau for 48h. Horizontal bars represent mean values in each condition. (B) Tr1 cells (CD4+IL-10+FOXP3+; open bars) and monocytes+IL-10+ (black bars) induced by BCG Moreau at 48 h in PBMC from healthy donor. Bars depict the mean levels (+ SEM) in each condition. **P < 0.01.
