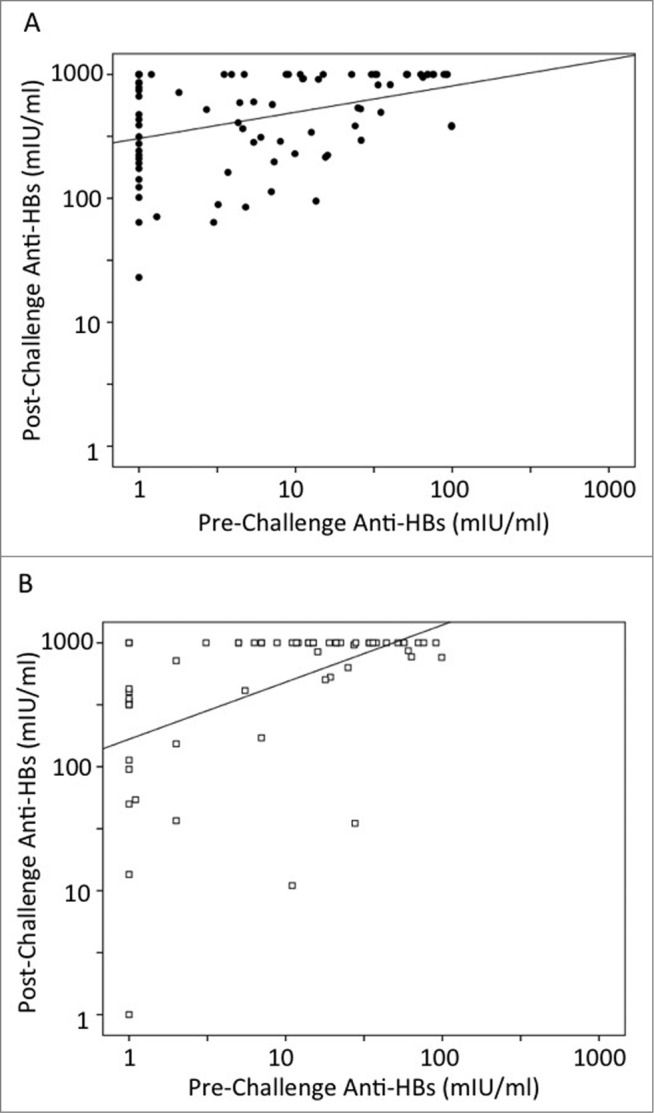
Figure 2.

Scatter plot analysis of anti-HBs responses for either Sci-B-Vac (A) or Engerix-B (B) challenged children. Cases with anti-HBs <1mIU/ml were calculated as 1 mIU/ml and those >1000 mIU/ml as 1000 mIU/ml respectively. The scatter plots represent the one-dose challenged cases (83 Sci-B-Vac and 60 Engerix-B respectively).
