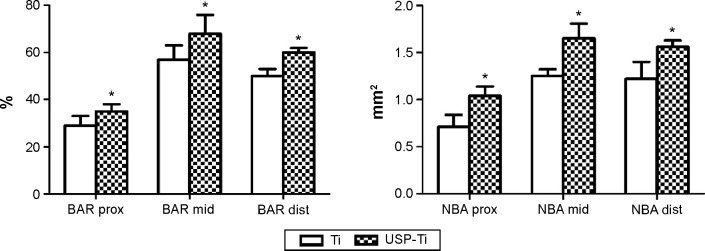
Figure 13.

The surface BAR (%) and NBA (mm2) of Ti and USP-Ti in the proximal, middle, and distal sections at 12 weeks.
Notes: Data are shown as the mean ± SD. *P<0.05 compared with Ti.
Abbreviations: USP-Ti, Ti surface subjected to USP; USP, ultrasonic shot peening; BAR, bone apposition ratio; NBA, new bone area; SD, standard deviation; Ti, titanium.
