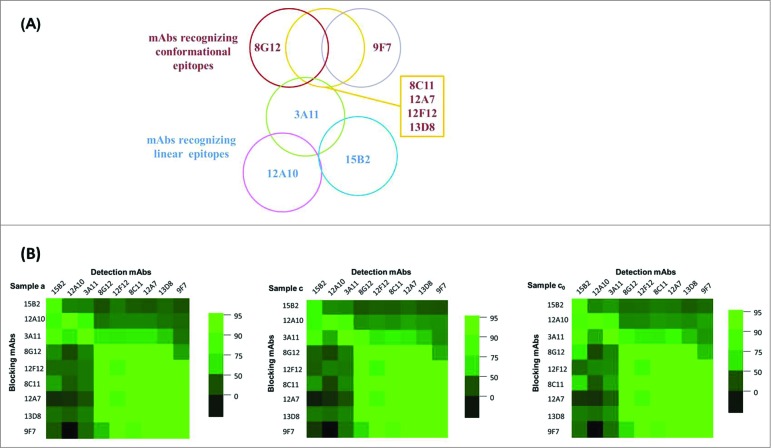
Figure 3.
Epitope mapping (9 × 9) using monoclonal antibodies for the comparable epitope overlap of HEV p239 in different samples. (A) The illustration of the epitope overlap for 9 mAbs. While four mAbs, 8C11, 12A7, 12F12, 13D8, recognized epitopes in a similar region. Their affinity and footprint sizes differed significantly (Zheng, ZZ, unpublished results). (B) The horizontal character is representative of a monoclonal antibody with an HRP enzyme, and longitudinal characters represent non-enzyme monoclonal antibodies. Each small grid represents the results of a monoclonal antibody blocking against an HRP-conjugated monoclonal antibody. Color gradient represents the change in blocking rate: green represents a blocking rate of more than 95%, and black represents a blocking rate is 0.

