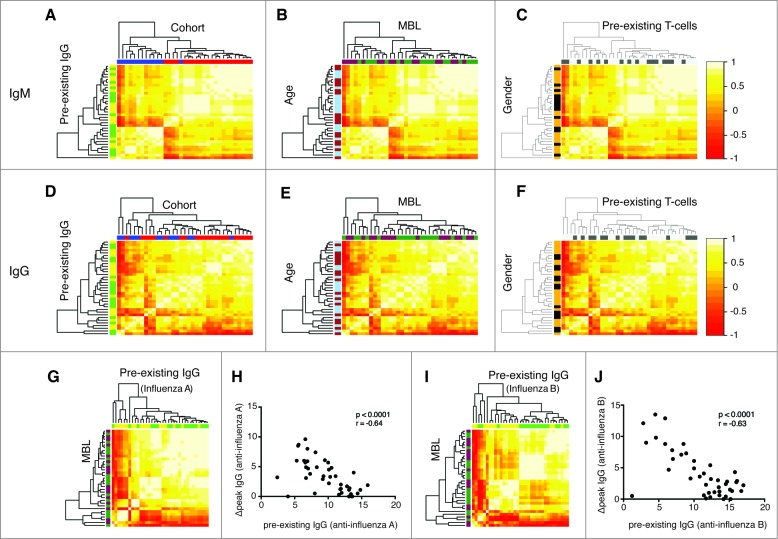
Figure 1.
Vaccine response profiles of healthy vaccinees cluster by vaccine preparation and pre-existing adaptive immunity. The hierarchical clustering of IgM (A, B, C) and IgG (D, E, F) profiles is shown. IgM and IgG profiles incorporate influenza-A and B-specific Ig levels. The heatmap depicts the pairwise Pearson correlation coefficients of all profiles determined. Factors were color-coded: Cohort (2007/2008: red, 2008/2009: blue), MBL (darkgreen: ≤ median, purple: >median), age (light blue: ≤ median, brown: >median), pre-existing IgG levels (green: ≤ median, yellow: >median), pre-existing T cells (dark gray: ≤ median, light gray: >median) and gender (black: female, yellow: male). Influenza A profiles clustered dependent on the pre-existing IgG against influenza A (G, green: ≤ median, yellow: >median), which was confirmed by a strong inverse correlation between these markers (H). The same was true for pre-existing IgG against influenza B (I, J). There was no clustering based on MBL levels (darkgreen: ≤ median, purple: >median) (G, H). Spearman Ranks correlation analysis was performed in Figures H and J. The clustering by pre-existing IgG was determined to be significant (P < 0.05).

