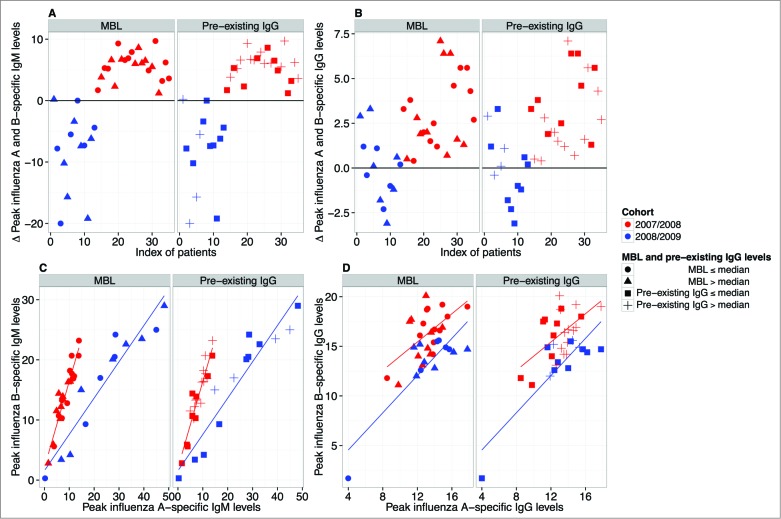
Figure 2.
Preferential targeting of influenza A or B depending on vaccination. For each individual the difference in peak values of anti-influenza A and B levels for both IgM (A) and IgG (B) was calculated. The 2008/2009 (inactivated split-vaccine, Mutagrip®) cohort is depicted in blue and the 2007/2008 (virosomal vaccine, Inflexal®) cohort in red. IgM (A) and IgG (B) profiles are shown. (C) Correlation analysis of influenza A- and influenza B-specific IgM (C) and IgG levels (D) is shown (red = 2007/2008 cohort; blue = 2008/2009 cohort). The effects of both low (closed circles: ≤median) and high MBL levels (triangles: >median) as well as low (closed squares: ≤median) and high (crosses: >median) pre-existing IgG levels are displayed. Pearson correlation coefficients for IgM in the 2007/2008 and 2008/2009 cohort were r = 0.94 and r = 0.95; for IgG r = 0.57 and r = 0.85, respectively. All correlations were found to be significant (p < 0.001).

