
Figure 3.
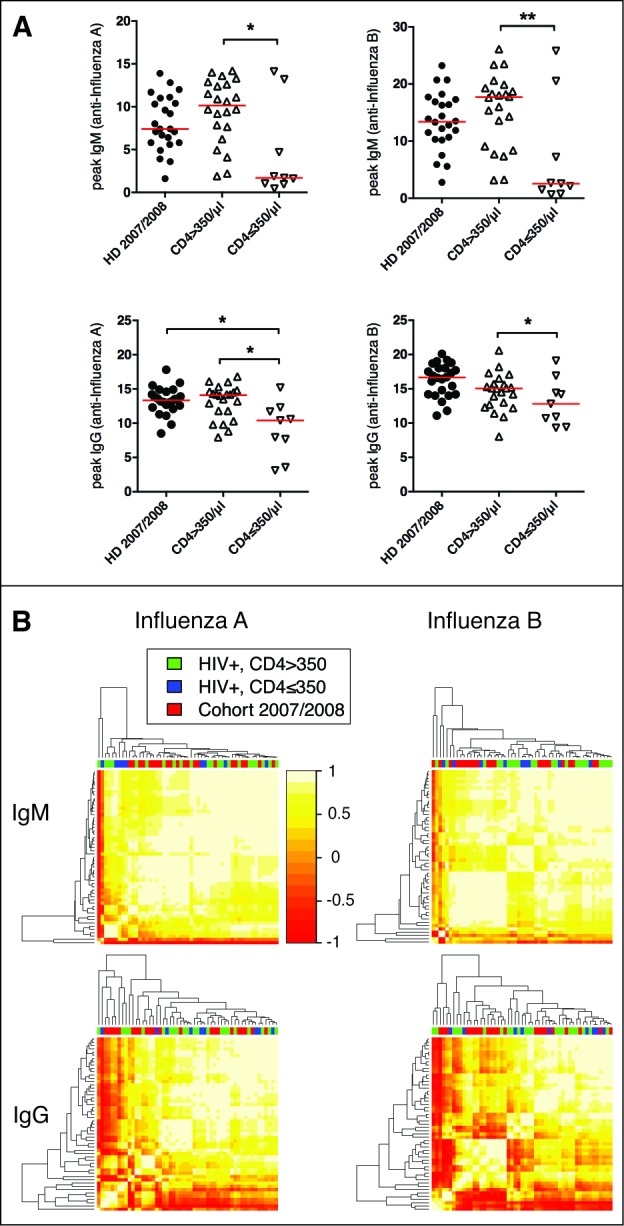
Immunoglobulin profiles do not cluster by HIV status or level of immunosuppression. (A) Peak IgM and IgG responses against influenza A and B are shown as VE/mL. HD = healthy donor, CD4 high = HIV infected individuals with CD4 counts >350/μl, CD4 low = HIV infected individuals with CD4 counts ≤350/μl. *P < 0.05, **P < 0.01. (B) The hierarchical clustering of the IgM (influenza A or B) and IgG (influenza A or B) vaccine response profiles indicated no difference between these 3 groups. The heatmap depicts the pairwise Pearson correlation coefficients of all profiles determined.