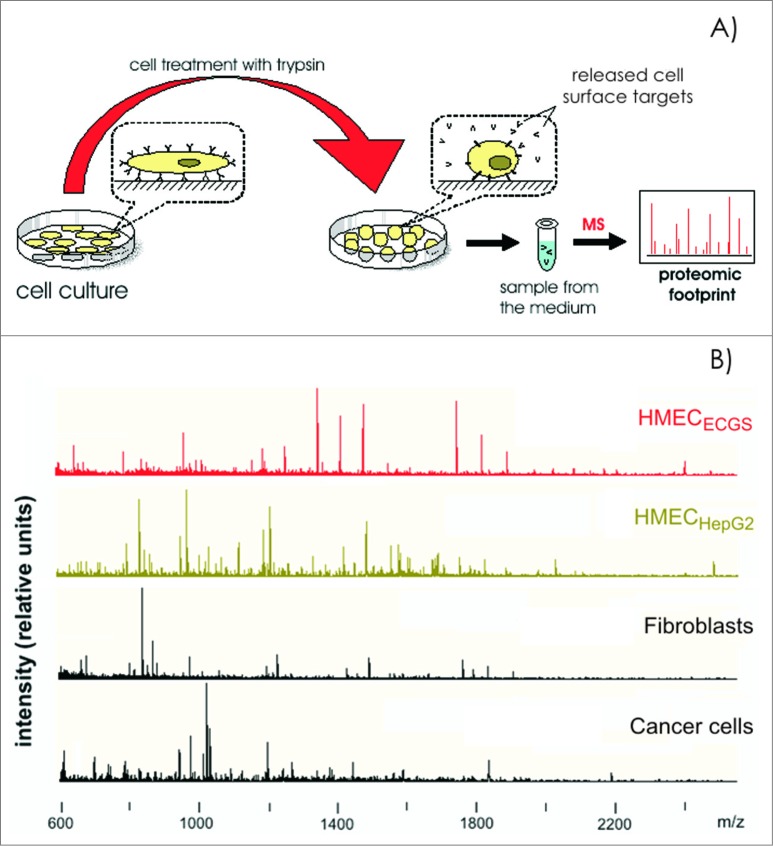
Figure 2.
Cell proteomic footprinting. (A) Adherent cell culture after washing away traces of culture medium and subsequently treated with a protease. Released fragments of the cell surface proteins were collected and subjected to mass spectrometry analysis. The set of obtained peptide molecular weights represents the cell culture proteomic footprint. (B) Examples of cell proteomic footprints for non-ECs (MCF-7 and HepG2) and HMECs induced to grow in the presence of stimuli provided from normal tissue (HMECECGS) or cancer cells (HMECHepG2). Adapted from.37,41

