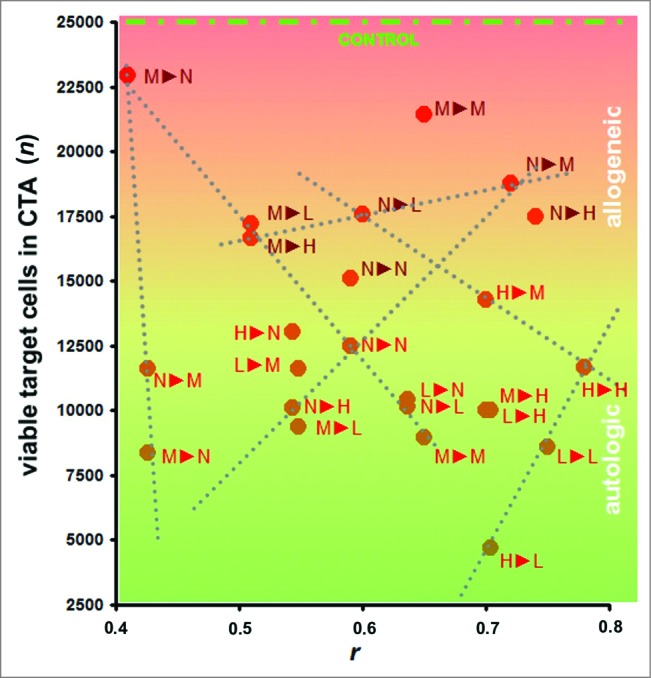
Figure 5.

Cytotoxicity assays (CTAs). Data represent the cytotoxicity of effector CTLs against target HMECs, plotted vs. the similarity between surface profiles of target cells and cells used as a source of antigens for eliciting the targeted immune response. Data represent the mean value of 3 independent measurements. The similarity between the cell surface profiles is presented as the correlation coefficient r between corresponding proteomic footprints. 1▸2 – First letter corresponds to HMECs used as a source of antigens for eliciting immune response in the CTA, and the second letter corresponds to the target HMECs used in the same CTA. Red and brown letters correspond to autologous and allogeneic antigens, respectively. Different letters are used to identify HMECs stimulated to grow in the presence of an EC growth supplement (G), MCF-7 cell-conditioned medium (M), LNCap cell-conditioned medium (L), or HepG2 cell-conditioned medium (H). Data were scaled to bring all controls to equal values (25,000 cells, see CONTROL line). Dashed lines show examples of linear dependence (n = k*r + b) between CTA data n and r. All data in the plot were described by linear equations, and the variations of the coefficients (k and b) were interdependent.37
