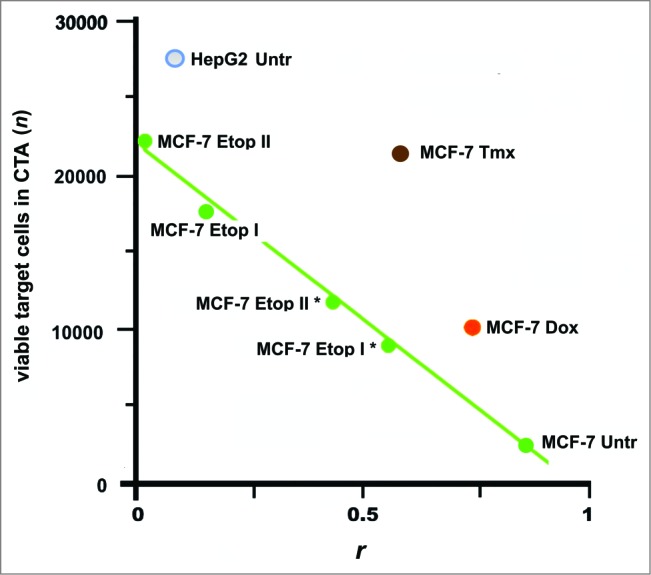
Figure 6.

Escape of cancer cells from the immune response in CТA as a result of cell surface profile changes induced by the selective pressure of drug treatment. These changes can lead to a loss of vaccine efficacy based on cancer cell antigens. Points are presented for MCF-7 and HepG2 cells that were untreated (MCF-7 Untr and HepG2) or MCF-7 cells treated as follows: IC96 doses of doxorubicin (MCF-7 Dox) or tamoxifen (MCF-7 Tmx); a single dose of IC96 etoposide (MCF-7 Etop I) or IC50 etoposide (MCF-7 Etop I*); and two separate doses of IC96 etoposide (MCF-7 Etop II) or IC50 etoposide (MCF-7 Etop II*). Linear approximations for MCF-7 Untr and MCF-7 Etop I, II, I*, and II* (green line) are shown. The average number of viable cells in 3 wells is presented. Correlation values (coefficient r) were calculated for MCF-7 and HepG2 cell surface profiles used to generate antigens for eliciting immune response and the surface profile of target MCF-7 cells used in same CTA. Adapted from.47
