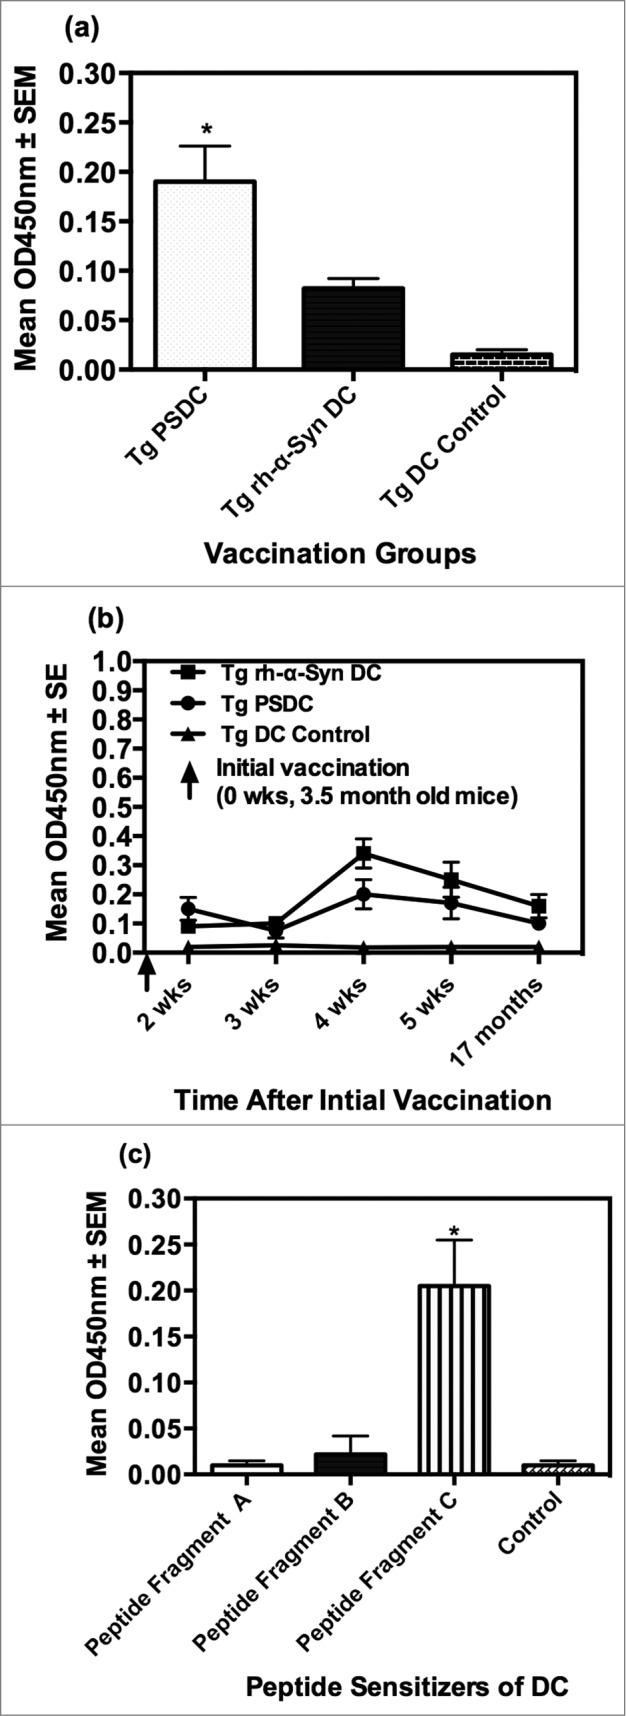
Figure 2.

Anti-α− Syn antibody responses elicited by PSDC or rh- α− Syn or rh- sensitized DC vaccines as measured by ELISA. (A) Ten days following the initial vaccination PSDC administered Tg (i.e. Tg PSDC) mice demonstrated a significantly higher anti-α−Syn antibody response, measured by OD450nm values, than did Tg mice vaccinated with rh-α− Syn sensitized DCs (i.e., Tg rh-α− Syn). OD450nm binding values are also provided for non-sensitized PSDC vaccinated mice (i.e. Tg DC Control). (B) Time course of anti-α− Syn antibody responses from analysis of sera from either PSDC (i.e., Tg PSDC) or rh-α− Syn DC sensitized (i.e. Tg rh-α− Syn DC) vaccinated mice. OD450nm binding values are also provided for non-sensitized DC vaccinated mice (i.e., Tg DC Control) (C) Demonstration that sensitization of DCs with peptide fragment C resulted in the highest anti-α− Syn peptide antibody responses of the 3 peptides tested. For analysis of data presented in (A), (B) and (C) above statistical significance was determined by the student t test with differences being significant at the 0.05 level and are indicated by *.
