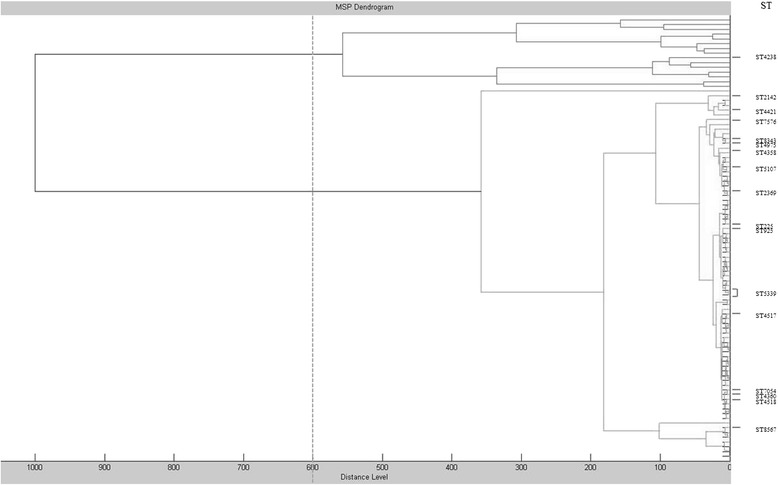
Fig. 3.

Cluster analysis of MALDI-TOF MS spectra obtained for 93 N. gonorrhoeae isolates. In the MSP dendrogram, relative distance between isolates is displayed as arbitrary units. Zero indicates complete similarity and 1000 indicates complete dissimilarity. The arbitrary distance level of 600 was chosen for isolates clustering evaluation. The STs listed in the Figure are different from the genogroup (G) 1407
