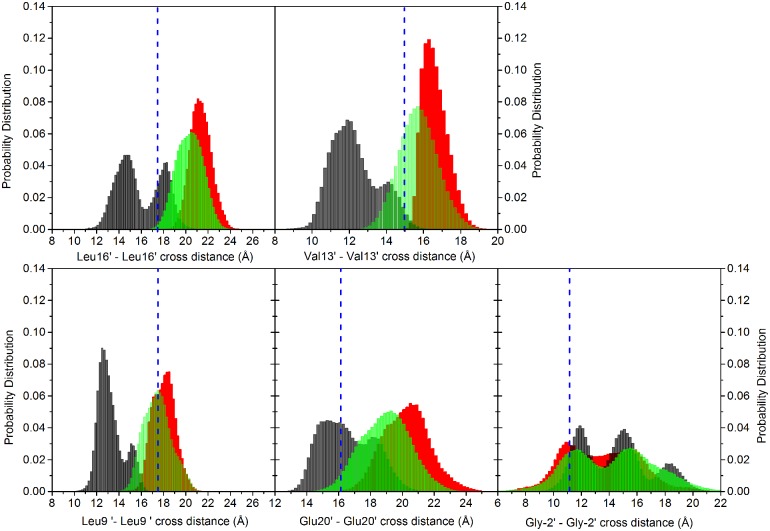
Fig 5. Distribution of the crossed distances.
Distributions of crossed distances between pairs of non-adjacent subunits for Leu at 16′, Val at 13′, Leu at 9′, Glu at 20′ and Gly at -2′; data collected from the five subunits. The vertical dashed blue line represents the value in the starting homology modeled configuration. Black bars: unrestrained; red bars: restrained; green bars: free simulations (data collected from the four free trajectories).

