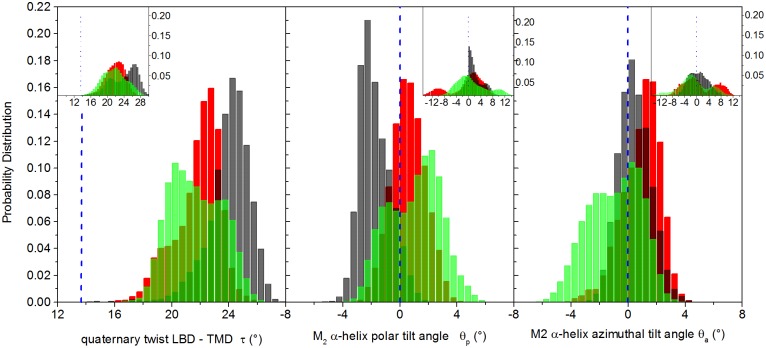
Fig 9. Twist and tilt angles.
Left panel: distributions of quaternary twist angle; central panel: distributions of the M2 helix polar tilt angle; right panel: distributions of M2 helix azimuthal tilt angle. Values averaged over the five subunits. In the insets, distributions calculated collecting data from the five subunits. The vertical dashed blue line represents the value in the starting homology modeled configuration. Black bars: unrestrained; red bars: restrained; green bars: free simulations (data averaged over the four free trajectories).

