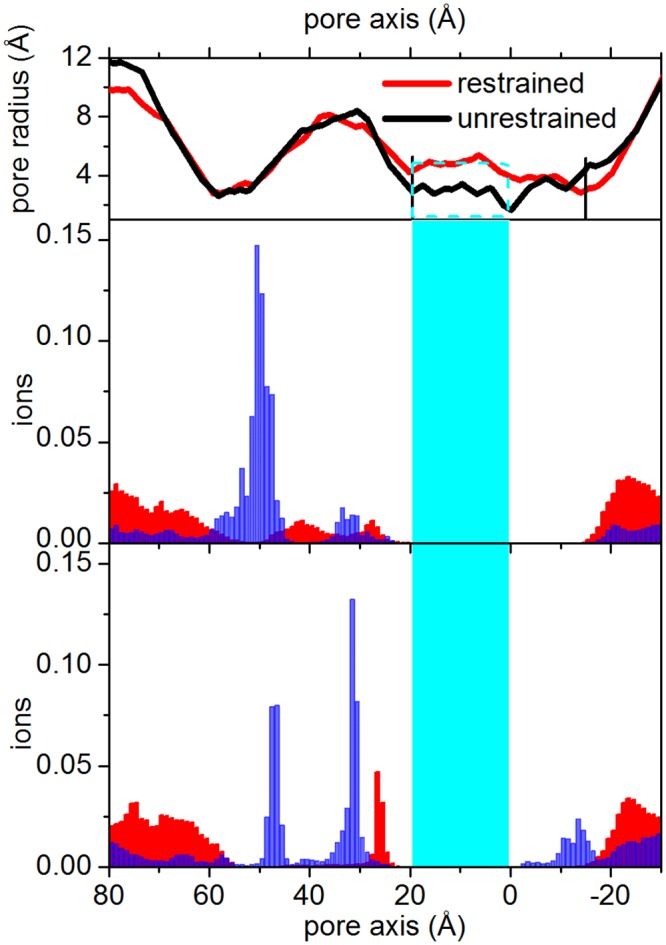
Fig 10. Ions distribution.

Blue bars: cations, that can permeate the nicotinic channel. Red bars: anions. Top panels show the channel pore profiles along the full-length protein. Central panel: restrained; lower panel: unrestrained trajectory. The cyan region including the cyan rectangle in the top panel) highlights the channel between Glu20′ and Leu9′. The vertical black lines on the pore profile highlight the cytoplasmic and the extracellular pore limits, from Gly2′ to Glu20′.
