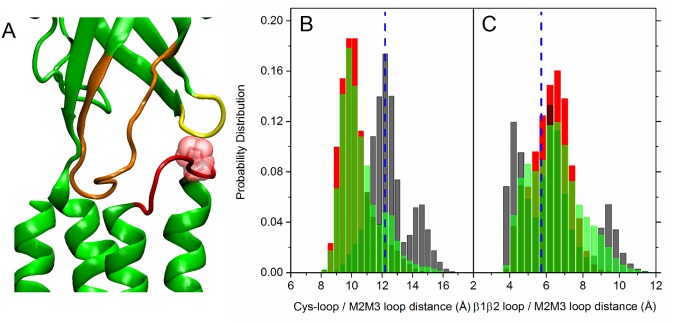
Fig 11. The LBD-TMD interface.
Left panel: Cys-loop (orange), β1-β2 loop (yellow) and M2-M3 loop (red) in one subunit in the initial configuration. Pro256 belonging to the M2-M3 loop is also shown (red) in vdW representation. Central panel: distribution of the distances between the Cα atom of Pro256 on the M2-M3 loop and the center of mass of the Cys loop (C α atoms of residues 122–136); right panel: distribution of the distances between the Cα atom of Pro256 on the M2-M3 loop and the Cα of residue Lys40 on the β1-β2 loop. Data collected from the five subunits. The vertical dashed blue line represents the value in the starting homology modeled configuration. Black bars: unrestrained; red bars: restrained; green bars: free simulations (data averaged over the four free trajectories).

