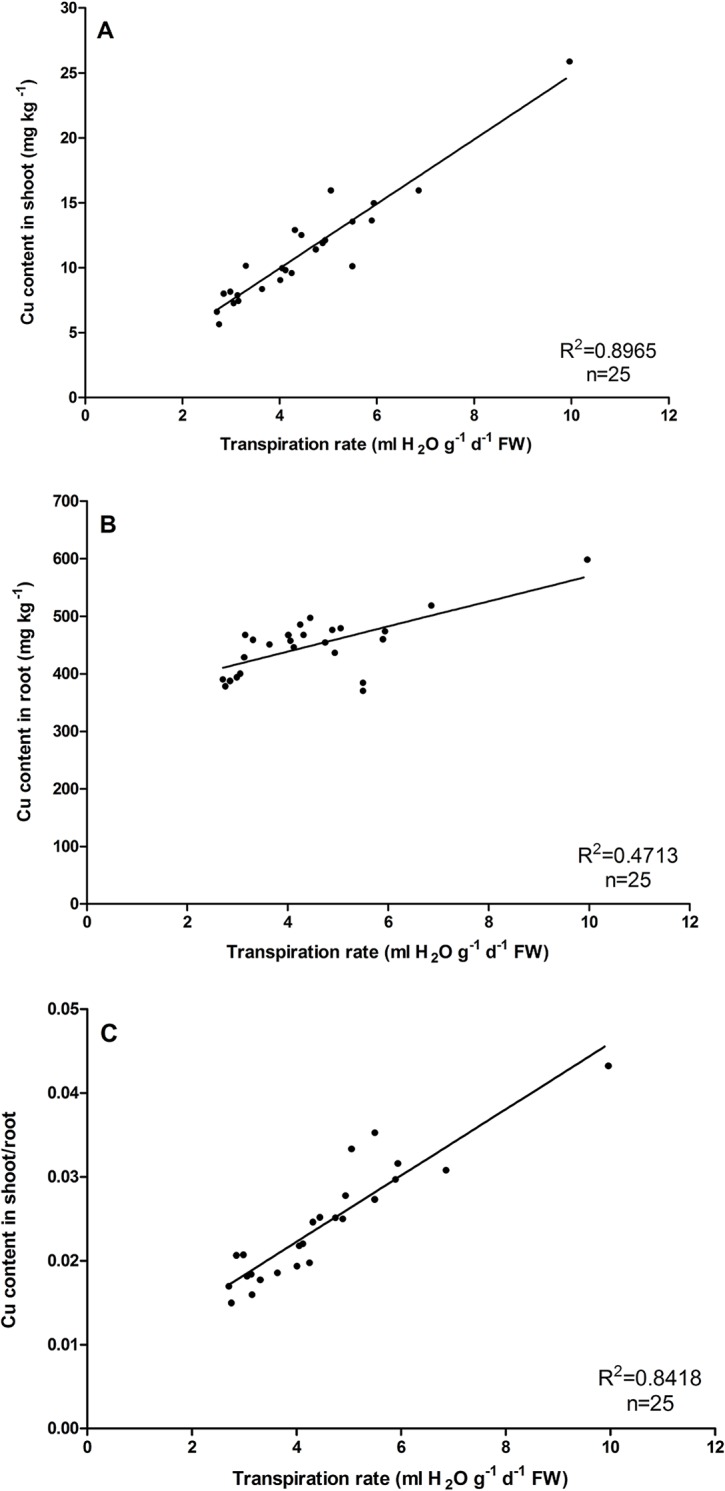
Fig 3. Relationships between the shoot Cu concentration (A), root Cu concentration (B) and the ratio of the Cu concentration in shoots to that in roots of O. glazioviana (C) and the leaf transpiration rate.

Mean value followed by different letter is statistically significant (ANOVA; Duncan multiple range test, p<0.01).
