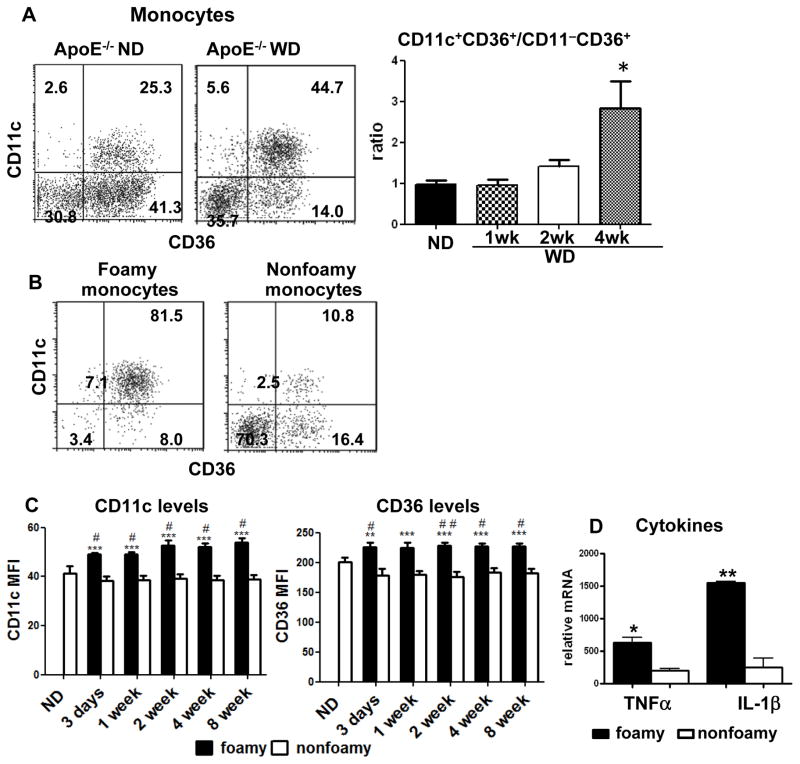
Figure 3. Some characteristics of foamy monocytes in apoE−/− mice on WD.
A, Representative examples of monocyte subsets (left panel) and relative ratios of CD11c+CD36+ to CD11c−CD36+ monocytes (right panel) in apoE−/− mice on ND or WD. n=4–6 mice/group. B, Representative staining for CD11c and CD36 of foamy and nonfoamy monocytes in apoE−/− mice on WD (4 weeks) from more than 5 independent experiments with at least 4 samples in each experiment. C, Comparisons of CD11c and CD36 mean fluorescence intensity (MFI) levels on foamy and nonfoamy CD11c+CD36+ monocytes in apoE−/− mice on WD or ND. n=5–9 mice/group. D, mRNA levels of TNFα and IL-1β in foamy and nonfoamy monocytes from apoE−/− mice on WD. n=3 samples, each of which were pooled blood from 5 mice. *P<0.05, ***P<0.001 versus ND group (in panel A) or nonfoamy monocytes (in panels C and D); #P<0.05, ##P<0.01 versus ND group (in panel C).

